Fig. 3.
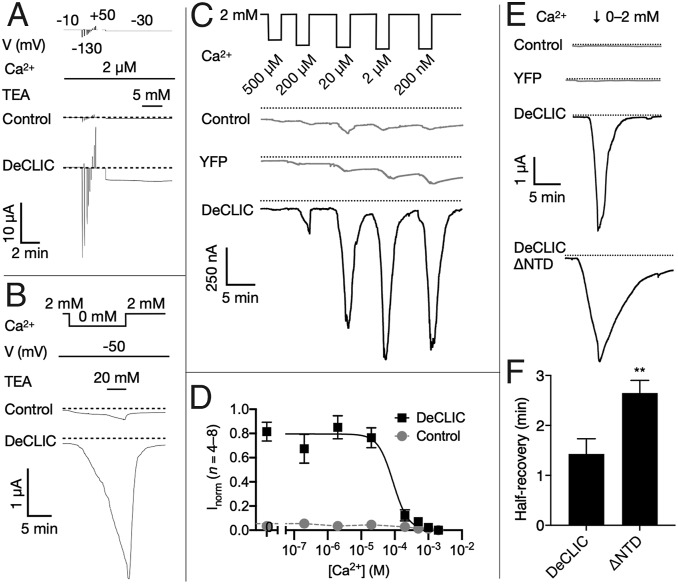
Functional evidence for Ca2+-inhibited DeCLIC currents. (A) Sample traces from two-electrode voltage-clamp electrophysiology in control and DeCLIC-injected Xenopus oocytes, showing equilibration in depleted Ca2+ (2 µM), voltage jumps to identify sustainable currents, then a voltage step (−30 mV) producing inward DeCLIC currents showing no desensitization nor inhibition by TEA (5 mM). Dotted lines represent 0-µA current. Although currents apparently reached a steady state, most oocytes did not tolerate activation by Ca2+ depletion beyond ∼10 min. (B) Sample traces under nonequilibrium conditions (−50 mV, 0 Ca2+), showing slowly developing currents not saturating after 12 min, and not inhibited even by high TEA (20 mM). (C) Sample traces to estimate Ca2+ sensitivity, showing brief (2-min) steps to decreasing Ca2+ concentrations at −70 mV. Maximum DeCLIC currents by this protocol saturated at 2 to 20 µM Ca2+, substantially larger than control or yellow fluorescent protein-expressing cells. (D) Inhibition curves for paired DeCLIC-injected (black squares) and control oocytes (gray circles) according to the protocol in C, normalized to the maximum response in parallel recordings. Solid black line represents nonlinear regression fit to DeCLIC responses, IC50 = 90 µM (n = 4 to 8, R2 = 0.8). (E) Sample traces documenting slowed kinetics of the truncated construct DeCLIC-ΔNTD, showing brief step to 0 mM Ca2+ followed by recovery to baseline in 2 mM Ca2+. Whereas DeCLIC currents decreased to half-maximum within ∼1.5 min, DeCLIC-ΔNTD half-recovery was roughly doubled. (F) Quantification of half-recovery time according to the protocol in E, showing significant slowing in DeCLIC-ΔNTD (n = 7, **P < 0.01).

