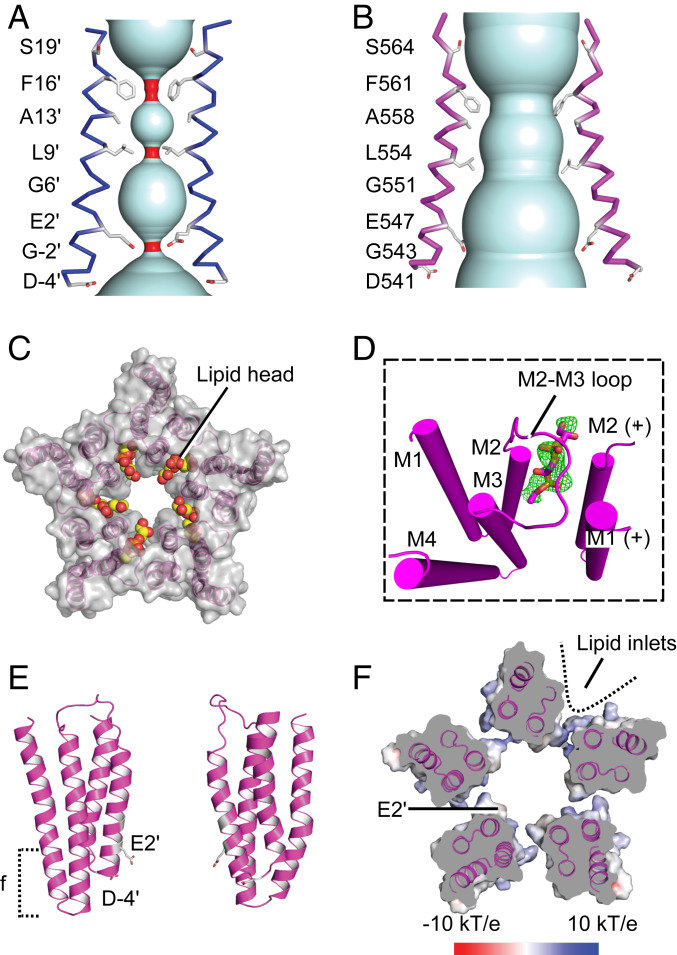
Fig. 6.
Pore conformation and lipid interactions in the TMD. (A) View from the membrane of the TMD channel (cyan) in the presence of Ca2+, showing M2 helices of two opposing subunits (blue). Side chains exposed to the pore lumen are shown as sticks, with constrictions of the channel below 1.4 Å in red. (B) View as in A of two opposing M2 helices (magenta) in the Ca2+-free structure. (C) View from the periplasmic side of the TMD surface in the absence of Ca2+, with resolved lipid head-groups as colored spheres. (D) View of two adjacent TMD subunits in the absence of Ca2+ (magenta), with polar heads of l-α-phosphatidylglycerol molecules modeled as sticks. The Fo-Fc omit map (green) is overlaid and contoured at 2.5 σ. (E) View from the membrane of two TMD subunits (blue) in the absence of Ca2+, showing negatively charged residues along channel as sticks. Dotted bracket indicates cross-sectional slice depicted in F. (F) A 20-Å cross section of the Ca2+-bound structure as indicated in E, viewed from the periplasmic side and colored by electrostatic potential according to the scale bar shown below; dotted line indicates an expanded crevice accessible to lipid tails.

