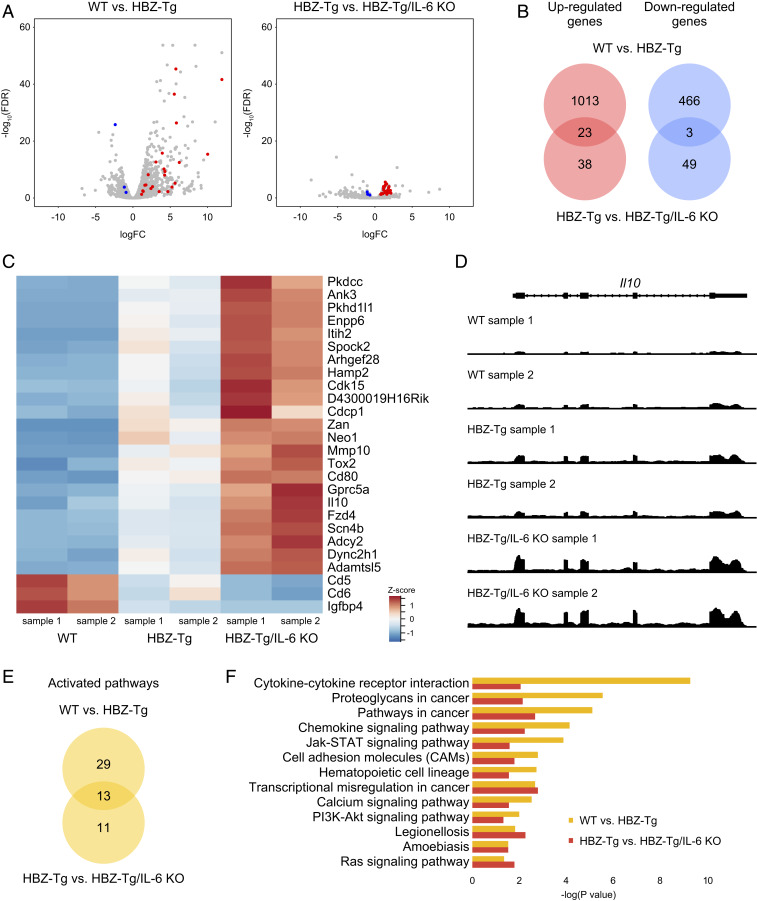
Fig. 3.
Expression profiles of splenic CD4+ T cells in each strain. (A) Volcano plots obtained from RNA-seq analysis of splenic CD4+ T cells. Red spots indicate genes that are significantly up-regulated in both a comparison of WT mice (n = 2) and HBZ-Tg mice (n = 2) and in a comparison of HBZ-Tg and HBZ-Tg/IL-6 KO mice (n = 2), while blue spots represent genes that are significantly down-regulated in both experiments (FDR >0.1). (B) Venn diagrams of the overlap of significantly up-regulated and down-regulated genes in WT vs. HBZ-Tg and HBZ-Tg vs. HBZ-Tg/IL-6 KO mice. (C) Heat map of expression profiles for the 26 significant genes (23 up-regulated and 3 down-regulated). (D) Expression tiling of Il10 in each sample. Genomic views of transcription at the Il10 gene locus in WT, HBZ-Tg, and HBZ-Tg/IL-6 KO mice are shown. The y-axis represents the number of reads at the locus, and the maximum read count is set to 500 for all samples. (E) Venn diagrams of significantly up-regulated KEGG pathways in WT vs. HBZ-Tg mice and in HBZ-Tg vs. HBZ-Tg/IL-6 KO mice. (F) Bar plots of significantly (P < 0.05) up-regulated KEGG pathways.

