Fig. 5.
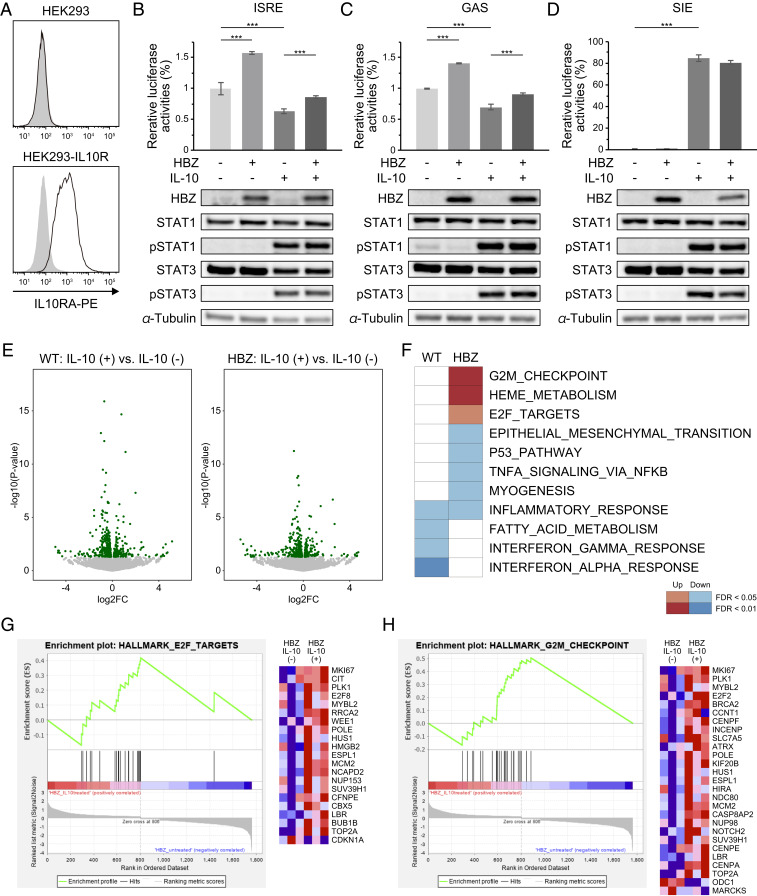
HBZ modulates IL-10/JAK/STAT signaling. (A) Flow cytometry analysis of IL10RA in HEK293-IL10R. Cell were stained by PE-conjugated anti-IL10RA antibody (black line) or isotype control (gray filled); two-tailed unpaired Student’s t test. (B–D, Top) Luciferase assay of ISRE, GAS, and SIE. HEK293-IL10R cells were transfected with HBZ, each reporter, and a reporter plasmid driven by cytomegalovirus immediate-early promoter as an internal control, and then stimulated with IL-10 (100 ng/mL). At 24 h after stimulation, luciferase activities were measured (two-way ANOVA with Turkey’s multiple comparisons). (Bottom) Immunoblotting of HBZ, STAT1, pSTAT1, STAT3, pSTAT3, and tubulin. (E) Volcano plots obtained from RNA-seq analysis of splenic CD4+ T cells of WT or HBZ-Tg (n = 3) cultured with or without IL-10 for 48 h. Green spots indicate differentially expressed genes (P < 0.05) between IL-10–treated and untreated cells. The results from WT and HBZ-Tg mice are shown in the left and right diagrams, respectively. (F) Enriched gene sets modulated by HBZ and IL-10 using GSEA. The top 2,000 differentially expressed genes in IL-10–treated cells compared with untreated cells from WT or HBZ-Tg mice were analyzed. (G and H) GSEA enrichment plots and heat maps of gene expression in CD4+ T cells from HBZ-Tg mice, with or without IL-10 stimulation.

