Fig. 4.
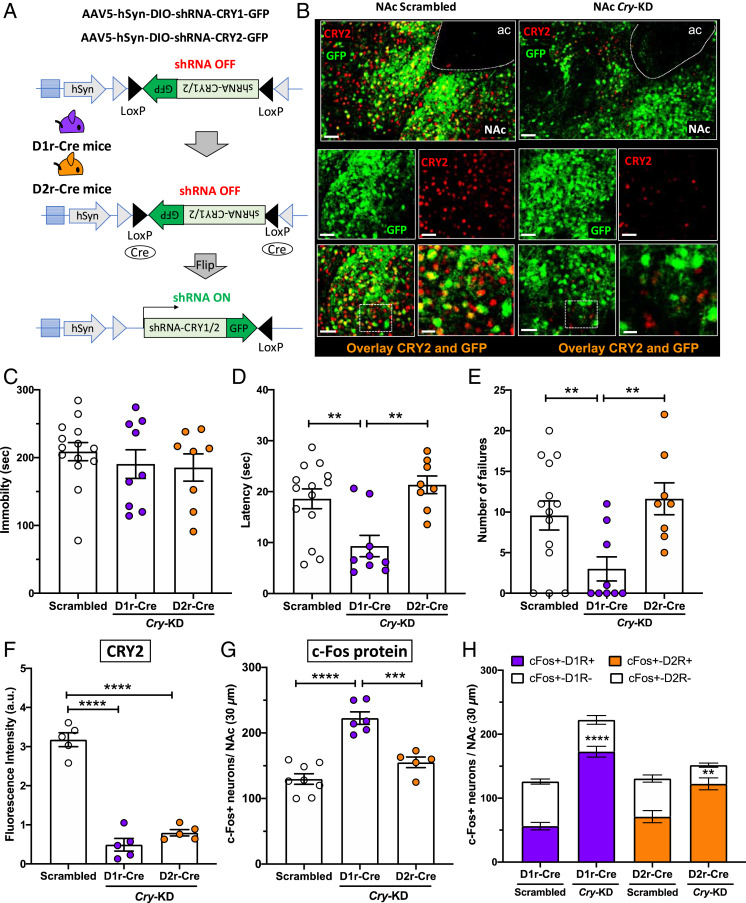
Cry KD in the NAc increases D1R-MSN neuronal activation and reduces helpless behavior in early night. (A) AAV expression constructs encoding GFP and an inhibitory shRNA targeting either Cry1 or Cry2 are shown before and after Cre-mediated recombination. In D1r-Cre and D2r-Cre mice, the NAc was injected with a mixture of two AAVs encoding a GFP reporter and either shRNAs for Cry KD (Cry-KD, one targeting Cry1 and the other targeting Cry2), or scrambled shRNA sequences as a control. (Scrambled D1r-Cre: males n = 3, females n = 4; Cry-KD D1r-Cre: males n = 4, females n = 5; Scrambled D2r-Cre: males n = 3, females n = 4; Cry-KD D2r-Cre: males n = 4, females n = 4). (B) Representative confocal micrographs of NAc from control mice (Left) or mice injected with Cry-shRNA (Right), showing transduced cells marked by GFP (green) and CRY2 protein detected by immunolabeling (red). The overlays show that most cells transduced with Cry-shRNA show reduced CRY2 expression. (Scale bars: 50 μm, except Bottom Right, 20 μm.) (C) Bar graph shows immobility time, (D) escape latency, and (E) number of escape failures of Cry-KD in D1r-Cre (purple circles) or Cry-KD in D2r-Cre (orange circles), compared to Scrambled sequence control (white circles). (F) Bar graph shows quantification of CRY immunofluorescence (arbitrary units), revealing an ∼70% reduction of CRY2 protein levels at ZT14, relative to control mice, in the NAc of D1r-Cre and D2r-Cre mice injected with Cry-shRNA. (G) Bar graph shows c-Fos expression at ZT14 in the NAc of D1r-Cre mice, D2r-Cre mice, relative to controls. For C–G, data are shown as means ± SEM; **P < 0.01, ***P < 0.001, ****P < 0.0001, one-way ANOVA with Bonferroni posttests. Each circle represents one mouse. (H) Bar graph shows the proportions of c-Fos+ neurons in D1r-Cre or D2r-Cre mice injected with virus encoding scrambled sequences (Scrambled) or Cry-shRNA (Cry-KD). Each column represents the number of c-Fos+ neurons counted in the NAc in a 30-µm section, and the colored sections show the number of c-Fos+ neurons identified as D1r-MSNs (D1R+, purple) or D2r-MSNs (D2R+, orange) by expression of the GFP reporter. The white sections show the number of c-Fos+ neurons identified as non–D1r-MSNs (D1R−) or non–D2r-MSNs (D2R−) by absence of GFP expression. Data are shown as means ± SEM, n = 4 to 6 mice for each condition. Student t test: c-Fos+D1r+ Scrambled vs. D1rCre Cry-KD ****P < 0.0001; c-Fos+D2r+ Scrambled vs. D2rCre Cry-KD **P < 0.01. For F–H, all cells within the NAc in a 30-µm section were counted.

