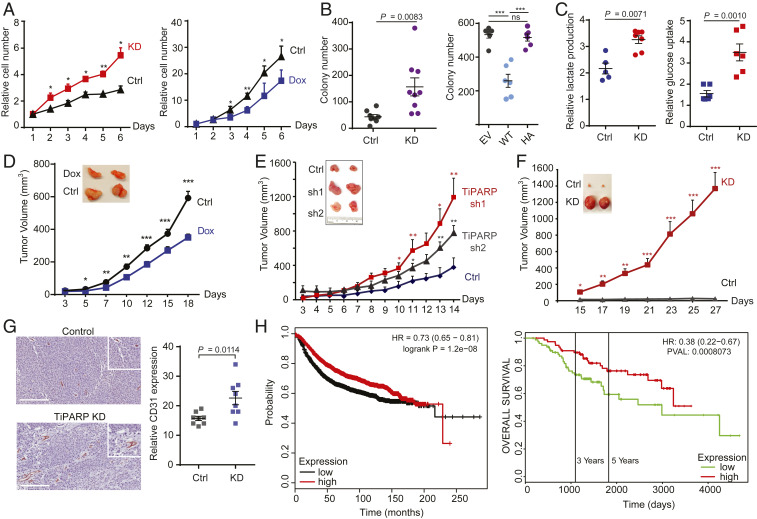
Fig. 5.
TiPARP represses Warburg effect and tumorigenesis. (A) TiPARP knockdown (KD) promoted (Left) while doxycycline (Dox)-induced TiPARP overexpression (Right) inhibited the 2D proliferation of HCT116 cells. Relative cell numbers were normalized to that of day 1. Error bars represent SD from three independent experiments. (B, Left) Anchorage-independent growth of HCT116 cells stably expressing shRNA targeting luciferase (Ctrl) or TiPARP (KD) (n = 9). (B, Right) Anchorage-independent growth of HCT116 cells treated with 1 μg/mL doxycycline to induce the overexpression of empty vector (EV), Flag-tagged WT TiPARP (WT), or inactive H532A mutant (HA) (n = 6). Colony numbers in each well of a six-well plate were counted. (C) TiPARP KD increased lactate production (n = 5) and glucose consumption (n = 6) in HCT116 cells cultured in hypoxia for 24 h. Values were normalized to normoxic controls. Data are represented as means ± SD (n = 5 for the control and n = 8 for the KD). (D) Xenograft tumor growth of HCT116 cells with (n = 22) or without (n = 18) Dox-inducible TiPARP expression. (E and F) Xenograft tumor growth of control (Ctrl) and TiPARP KD (sh1 and sh2) HCT116 cells (n = 8) (E) and MCF-7 cells (n = 9) (F). (G) Immunohistochemical analysis of CD31 expression in HCT116 xenografts. Vascular distribution in tumors was quantified by counting CD31-positive microvessels per 20× field (n = 8). (Scale bar, 200 μm.) (H) Kaplan–Meier survival curve of 3,951 (Left) and 157 (Right) breast cancer patients in TCGA, GEO, and EGA databases analyzed using miRpower and PROGgene. Patients were divided into two groups (top and bottom 50% TiPARP expression) based on TiPARP mRNA levels in their tumors. In A–G, results are shown as mean ± SD. ns, not significant. *P < 0.05; **P < 0.01; ***P < 0.001.

