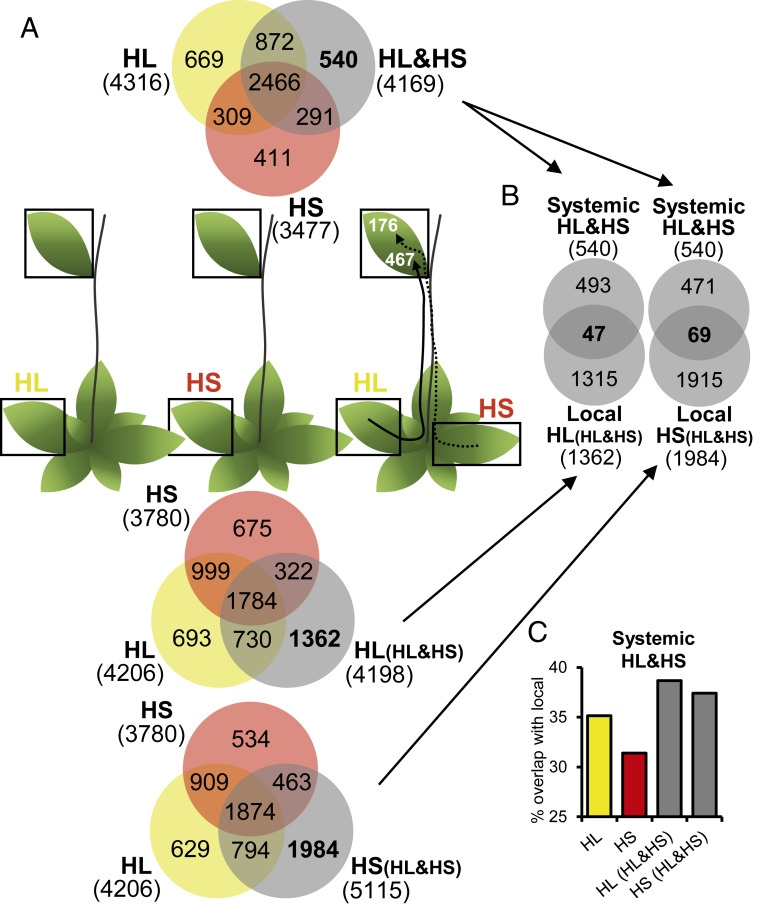
Fig. 2.
Plants can integrate two different systemic signals generated simultaneously at two different leaves of the same plant during stress combination. (A) Overlap between the systemic transcriptomic response of plants to a local application of HL, HS, or a combination of heat and light stress simultaneously applied to two different leaves (HL&HS). Venn diagrams for the overlap between the different responses are shown at the bottom for local leaves and at the top for systemic leaves. Black arrows in HL&HS plants represent the number of HL-specific (solid), or HS-specific (dashed) transcripts common between local and systemic leaves. (B) Venn diagrams showing the overlap between stress combination-specific transcripts from local (HL or HS) and systemic leaves. (C) Bar graph showing the percent overlap between the systemic HL&HS response and local HL, HS, HL(HL&HS), or HS(HL&HS) responses. All experiments were repeated at least three times with 40 plants per biological repeat. All transcripts included in the figure were significantly different from controls at P < 0.05 (negative binomial Wald test followed by Benjamini–Hochberg correction). HL(HL&HS) and HS(HL&HS) denote a local HL- or HS- treated leaf of a plant subjected to HS or HL on another local leaf, respectively.

