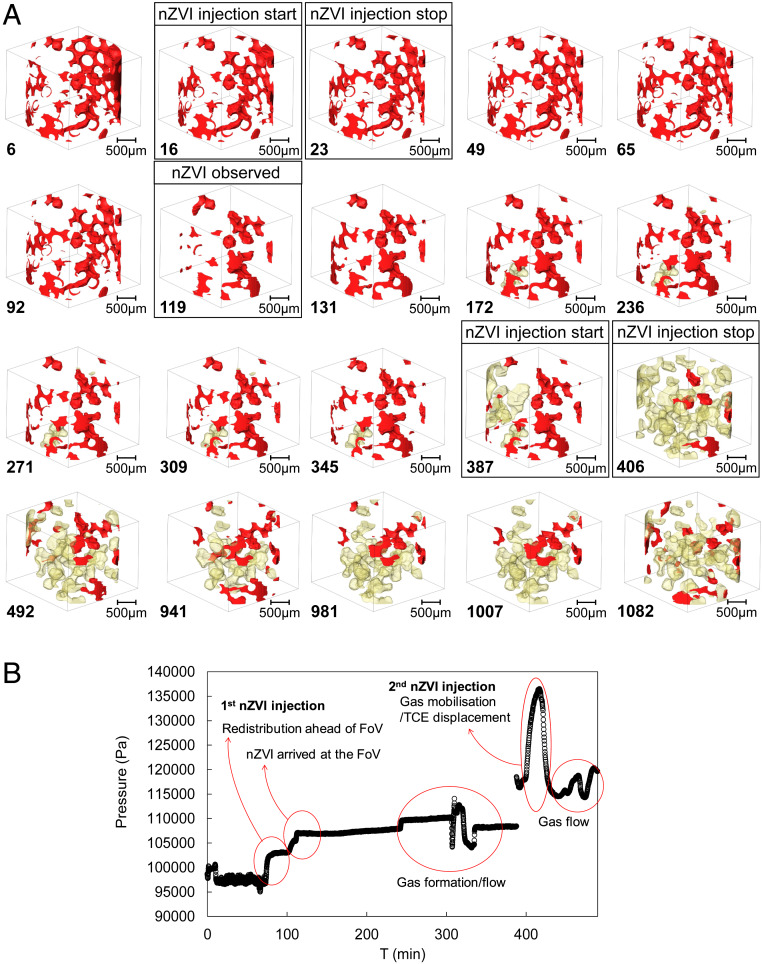
Fig. 2.
(A) Three-dimensional renderings of the TCE phase as a function of time (noted at Bottom Left of each image, in minutes). The black boxes show the time steps of specific significance. (Scale bar, 500 µm.) TCE and gas are rendered in red and light yellow, respectively. (B) Injection pressure as a function of time.

