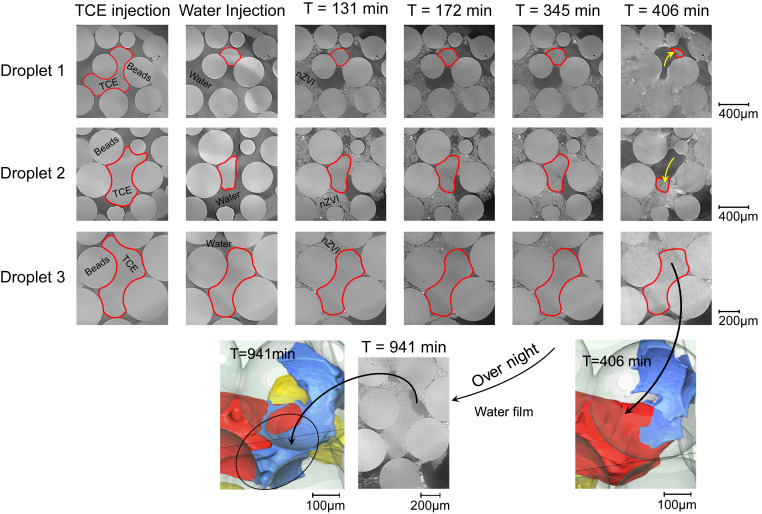
Fig. 5.
Example 2D µCT slices through the droplets shown in Fig. 4. The round objects are the beads. Shown are TCE (light gray, homogeneous), water (medium gray), gas (dark gray, homogeneous), and nZVI suspension (irregular light gray with bright spots). TCE phase boundaries are highlighted with red lines for better clarity. Gas displacing TCE is shown with yellow arrows. For 3D renderings colors are explained in the Fig. 4 legend.

