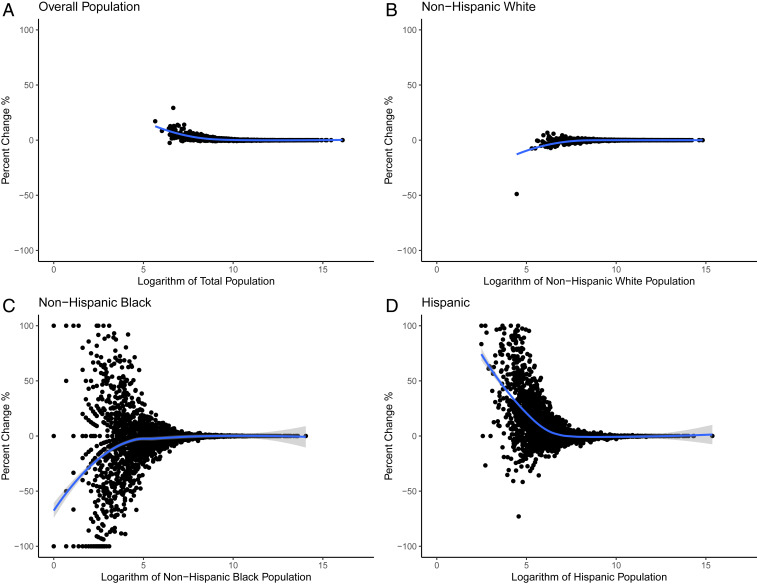
Fig. 1.
Percent of population change at the county level due to the implementation of DP and 2010 population size (the logarithm scale of 2010 originally published counts): overall population (A), non-Hispanic whites (B), non-Hispanic blacks (C), and Hispanics (D). Comparisons are between originally published 2010 data and the 2010 data with noise infused by DP.

