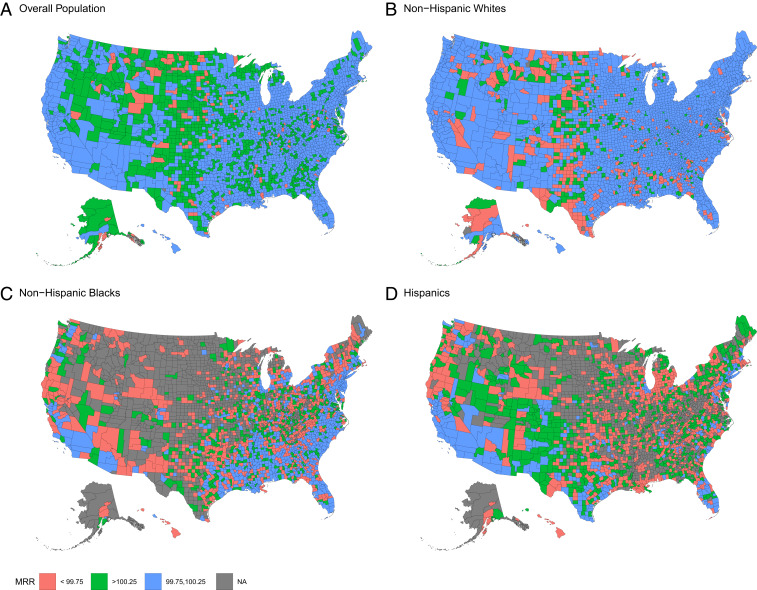
Fig. 3.
County-level mortality rate ratios for the overall population and three major racial/ethnic groups indicating whether the MRR was below 99.75 (red), within 99.75–100.25 (blue), or over 100.25 (green): overall population (A), non-Hispanic whites (B), non-Hispanic blacks (C), and Hispanics (D). MRR comparisons are between originally published 2010 data and the 2010 data with noise infused by DP. Counties that do not have enough information for the calculation of these rates are presented in gray.

