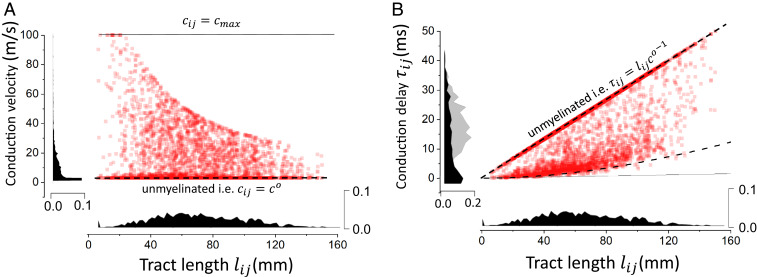
Fig. 4.
Distribution of conduction velocities and delays after myelination. (A) The distribution of conduction velocities as a function of tract lengths shows a negative correlation where longer connections are statistically slower. (B) Conduction delays as a function of axonal tract lengths. The distribution has two main components: delays that are linearly related to tract length (i.e., constant conduction velocity) and those that result from myelination. This second contribution exhibits a high degeneracy in which multiple combinations of lengths and velocities give rise to delays that are statistically similar. Here, , , , and .

