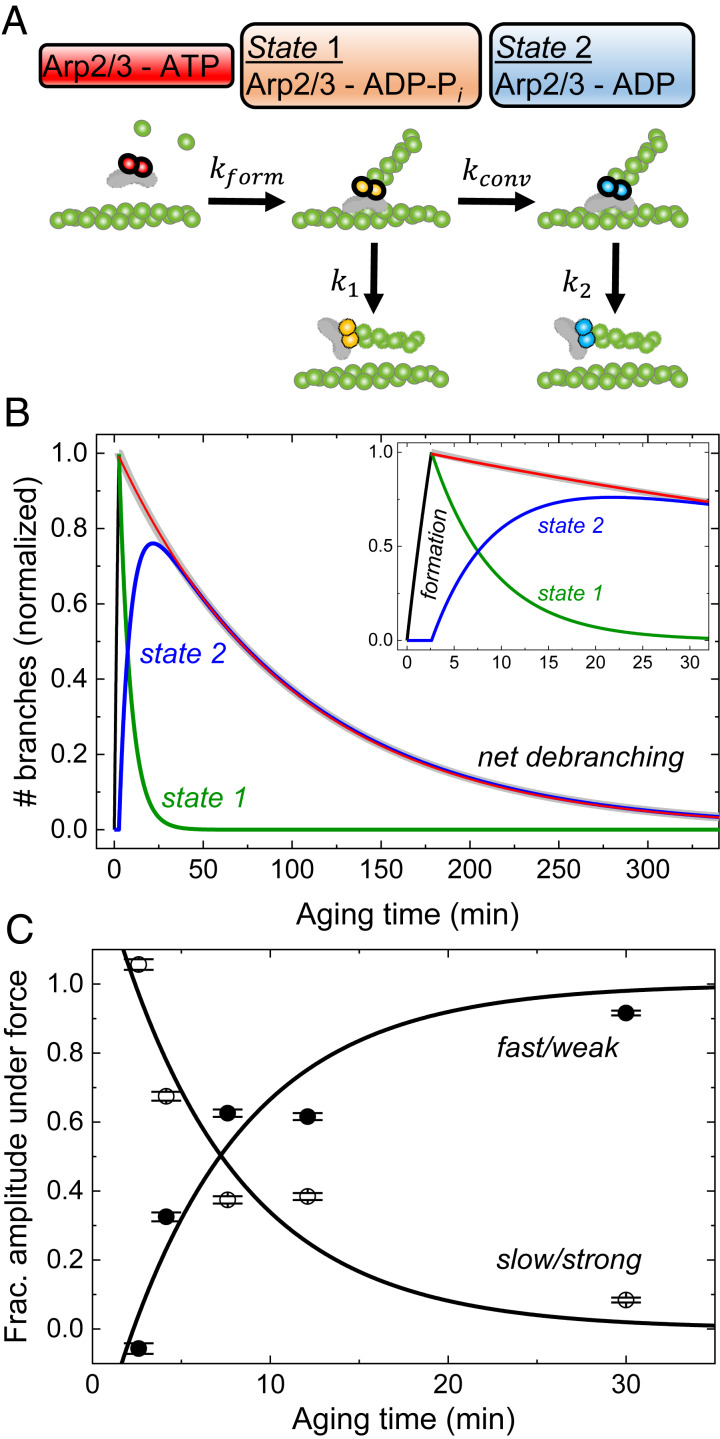
Fig. 4.
Model and simulations of the pathways of branch formation, aging, and debranching. (A) Schematic of our hypothesis. Formation of a branch by ATP−Arp2/3 complex (red) is coupled to hydrolysis of ATP bound to the Arps (5, 7) with rate constant kform, yielding ADP−Pi−Arp2/3 complex (orange) in state 1. Irreversible phosphate dissociation with rate constant kconv converts state 1 to ADP−Arp2/3 complex (blue) in state 2. Branches dissociate from mother filaments with rate constants k1 for state 1 and k2 for state 2, both sensitive to force. (B) Simulated time course of the model showing how the populations of state 1 branches, state 2 branches, and dissociated branches evolve over time in the absence of force. We assumed that Mg-ATP-actin monomers and Mg-ATP−Arp2/3 complex formed branches for 2.6 min, when the free proteins were removed, and the reactions continued without additional branch formation. The red line represents the best single exponential fit to the observed debranching (i.e., combined from both states) starting with a normalized value of 1 at the end of branch formation (2.6 min). The experimentally determined or estimated rate constants used in the simulation are kform[Arp] = 0.12 min−1, kconv = 0.14 min−1, k1 = 0.012 min−1, and k2 = 0.01 min−1. (C) Aging time dependence of the fractional the slow and fast phase amplitudes in the debranching time courses under 500 µL⋅min−1 of buffer flow, obtained from double exponential fits to the time courses (Fig. 2B). These data were used for extraction of fundamental rate constants in Table 1. The best global fits of the two-state model (Eq. 2) to the fractional amplitude data gave rate constants for conversion kconv of 0.14 min−1, state 1 branch dissociation k1 of 0.012 s−1, and branch formation kform, of 0.02 μM−1⋅s−1 without force (Table 1). The one negative fast phase amplitude at 2.6 min results from a net increase in the state 2 branch population during debranching under force after 2.6 min aging time. The state 2 branch population is the net sum of depletion from debranching (negative contribution to population, exponential decay) and gain from conversion of state 1 branches (positive contribution, exponential rise). For short aging times, little or no state 2 branches exist for depletion, and the conversion from state 1 branches, represented by an exponential rise (negative amplitude), dominates the time course (54, 55). The uncertainty bars are SDs of the fractions of branches from the global double exponential fits of debranching time courses with different aging times in Fig. 2B.

