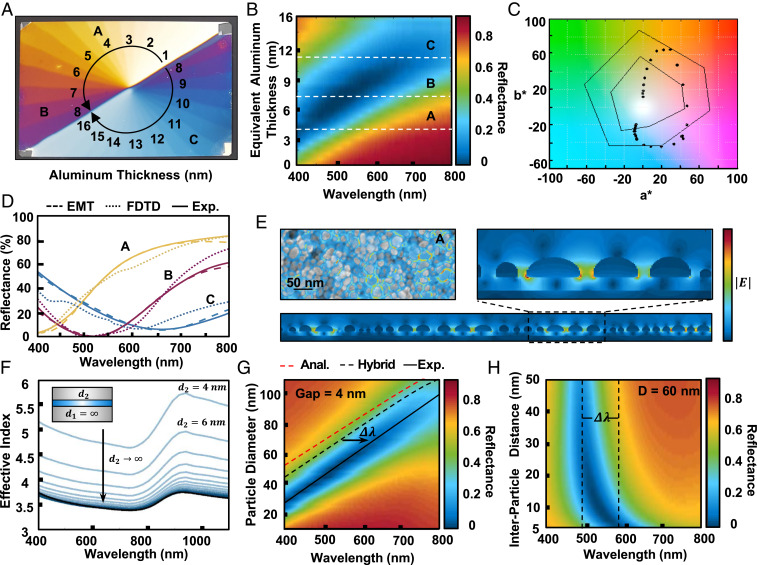
Fig. 2.
Particle size-dependent plasmonic color and quality. (A) Camera image of a 1- × 2-in. sample in which the amount of aluminum deposited is azimuthally varied. This changes the size of particles and results in the reflectance spectra seen in B. White dotted lines indicate thicknesses corresponding to 4, 7.5, and 11 MET. (C) The CIELAB space diagram where black dots indicate values for the surface color in A and B. Black outlines indicate print industry standards ISO 12647-3 for the inner hexagon and SWOP coated 1, ISO-standard on grade 1 high-quality photo paper for the outer hexagon. (D) Reflectance measurements of the surface compared to discrete dipole approximation theory and finite difference time domain modeling. (E) Field profiles obtained through FDTD at resonance showing field confinement in the gaps between particles. (F) Finite element method modeling of an MIM system as a function of top metal thickness. (G) FDTD simulations predicting resonance location as a function of particle diameter. The dotted red line shows the MIM model resonance location, while the dotted black line shows the hybrid MIM model taking into account finite film thickness. The solid black line indicates the experimentally observed location. (H) FDTD simulations over interparticle distance in which the shift in resonance location from the MIM model and experiment is found to be due to near-field coupling of adjacent particles.

