Fig. 6.
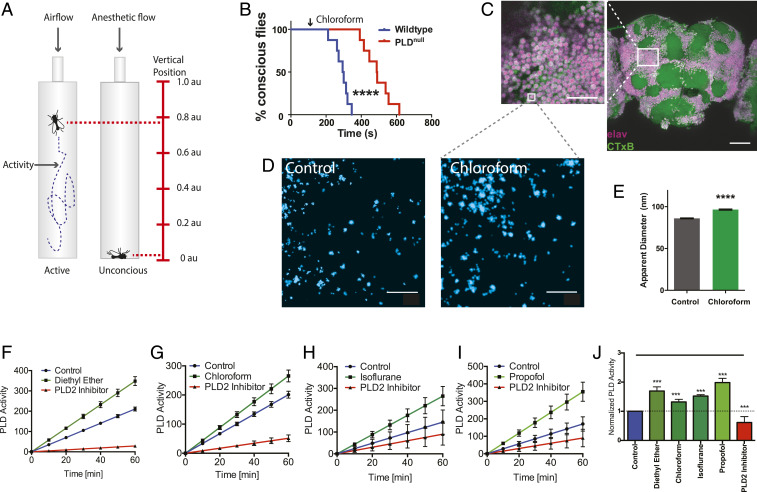
Phospholipase D (PLD) regulates anesthetic sensitivity in D. melanogaster. (A) Diagram depicting the setup of the anesthetic treatment and the positional recordings of the flies. Fly positions were used to confirm anesthesia. (B) Sedation curves showing the percent of unconscious flies over time after chloroform treatment (2.8 mmol/L of air volume) in both WT and PLDnull flies. (C) Confocal images showing robust labeling of GM1 rafts (CTxB, green) in the membranes of labeled neurons (pan-neuronal Elav antibody, purple) of the whole fly brain. (Scale bar, 500 µm and 25 µm for the zoomed panel.) (D and E) Flies were treated with chloroform and the GM1 rafts of whole-brain tissue were assayed for anesthetic-induced disruption by super-resolution imaging (dSTORM). (D) Super-resolution images with (Right) and without (Left) sedating chloroform. (E) Quantitation of apparent raft size diameter from fixed whole fly brain with and without chloroform. Similar to raft disruption in tissue culture, the GM1 rafts expand in brains of flies treated with chloroform (96.5 ± 0.7 nm vs. 86.0 ± 0.5 nm, respectively). Gray dotted lines indicate a hypothetical zoom compared to the low-resolution imaging of confocal in C. (mean ± SEM, n = 16,000 to 17,500, where n is the measurement of an individual raft size). (F–I) PLD assays on fly neuronal cells (ML-DmBG2-c2) confirming the activation of PLD by anesthetics: diethyl ether (1 mM) (F) chloroform (1 mM) (G), isoflurane (1 mM) (H), and propofol (50 µM) (I). (J) Bar graph of normalized activity of PLD in F–I at 60 min (mean ± SEM, n = 3 to 4) (Student’s t test results: ***P < 0.001; ****P < 0.0001).

