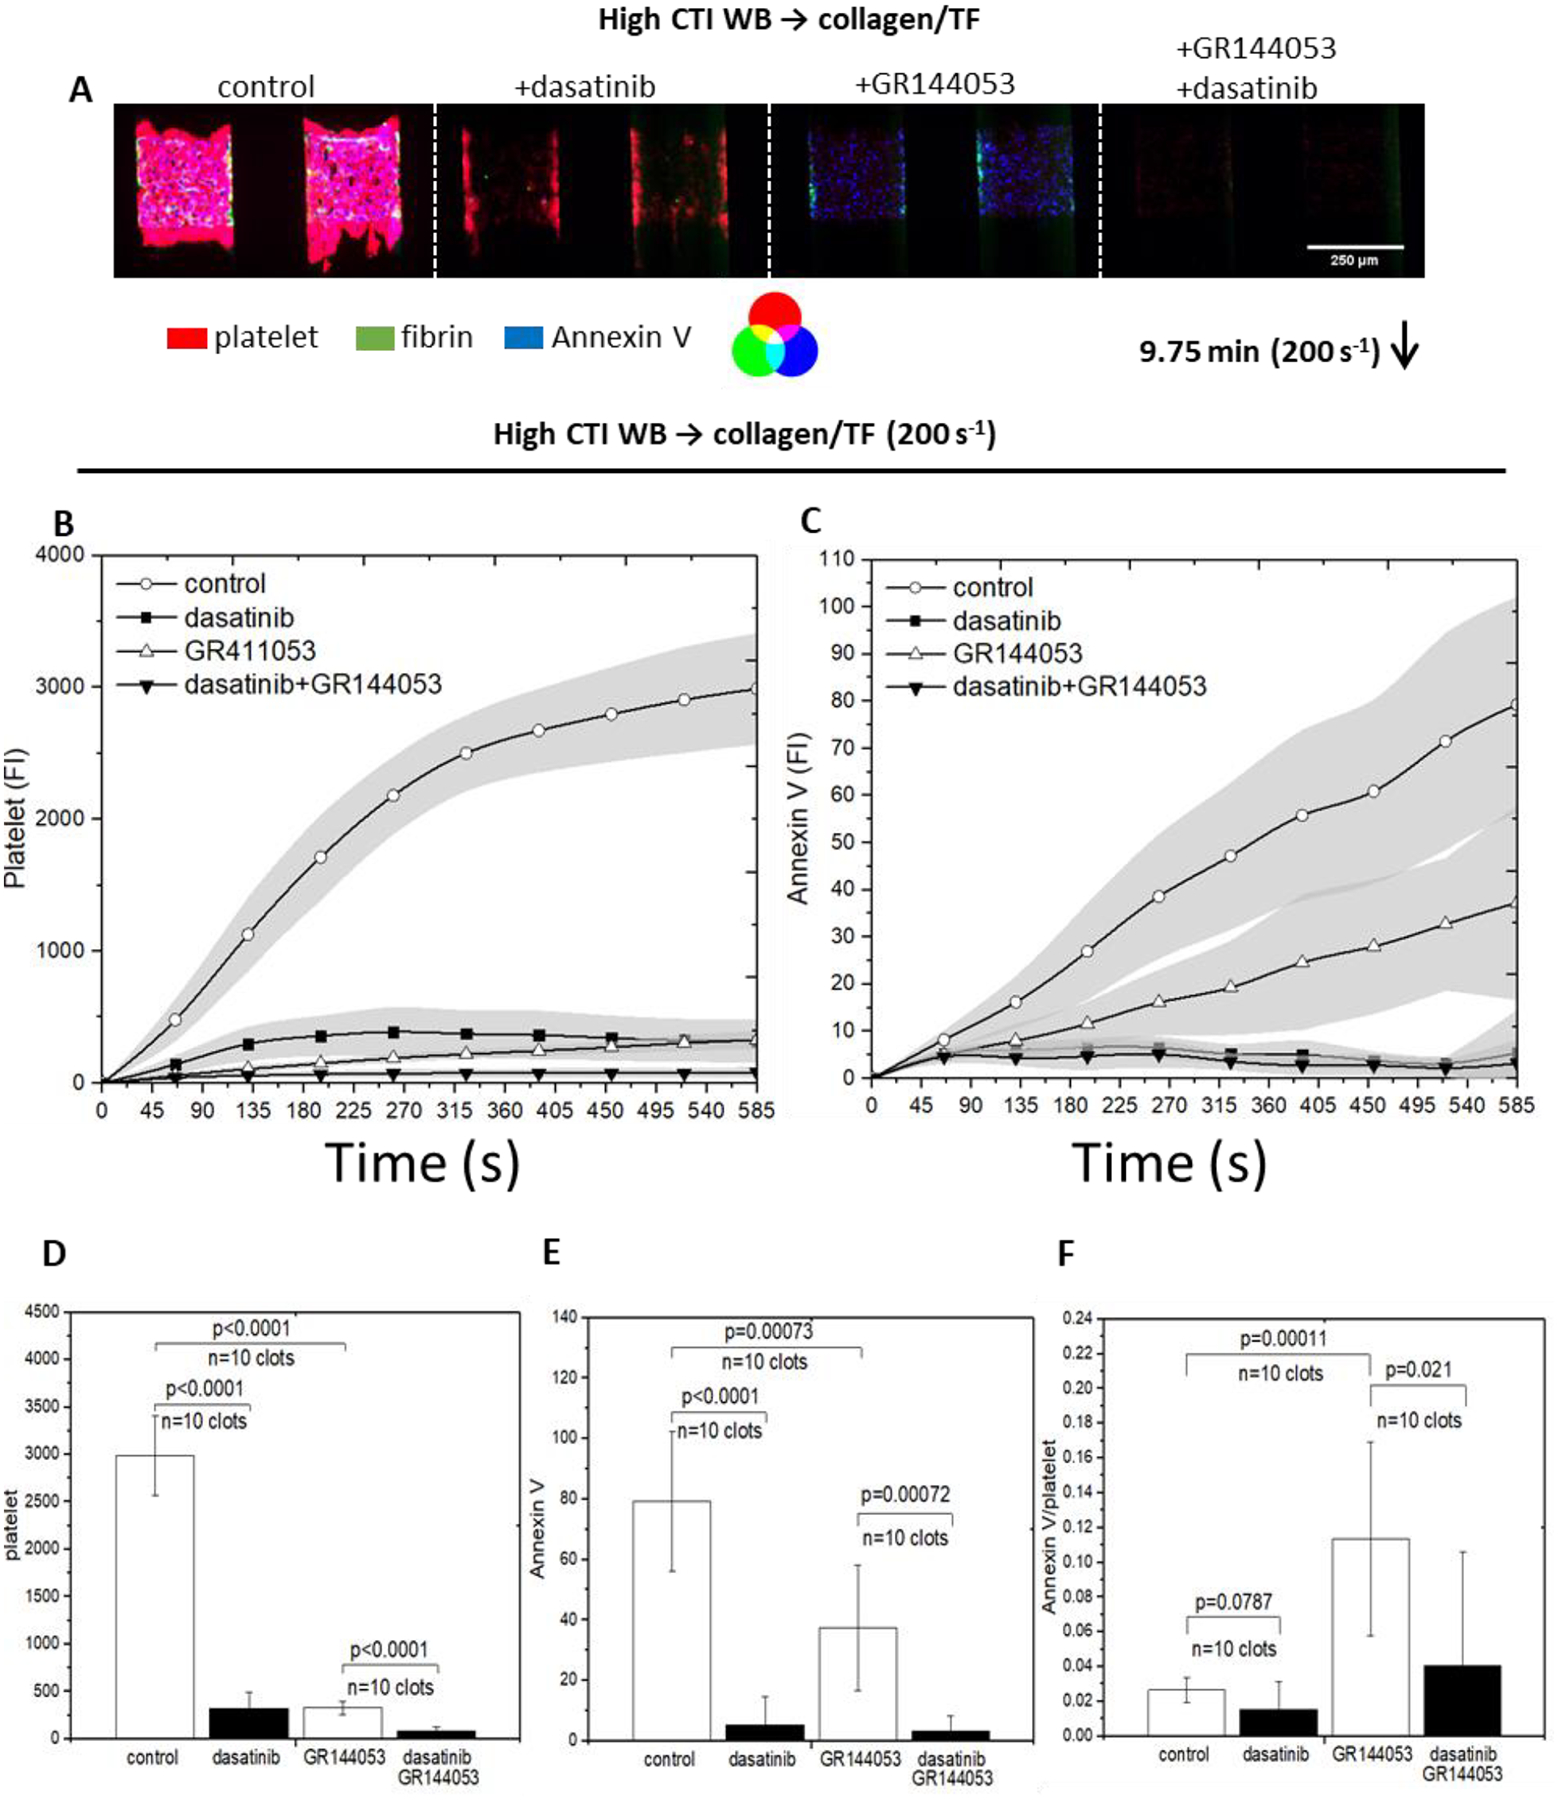
Figure 5. The intensities of platelet, fibrin and Annexin V for all conditions under venous shear rate (200 s−1).

High CTI blood was perfused over collagen incubated with TF. Dasatinib was added to inhibit Src and GR144053 was added to form monolayers. The montage images of clots/monolayers were taken for platelet, fibrin and Annexin V at 9.75 minutes under 10× (A), direction of blood flow was shown as the arrow. Fluorescent intensities of platelet (B) and Annexin V (C) were plotted over 9.75 minutes for all conditions. Platelet intensities were inhibited for both presence of dasatinib and GR144053, but Annexin V intensity was not inhibited by the presence of GR144053. Bar charts of fluorescent intensities of platelet (D) and Annexin V (E) at 9.75 minutes for all conditions illustrate the end point comparison; Annexin V signal on per-platelet basis was achieved by obtaining the ratio of Annexin V/platelet signal (C); the highest ratio is obtained by monolayer without dasatinib, implies that primary platelet deposition is crucial for clot development.
