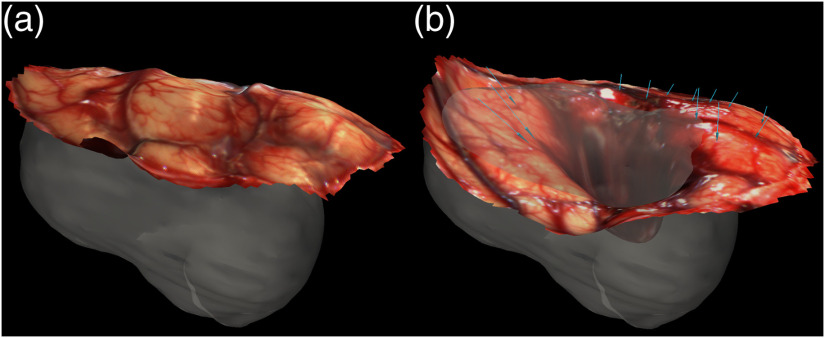
Fig. 1.
An illustration of cavity collapse during tumor resection for patient 1. The opaque shape in (a) and (b) is a visualization of the segmented tumor. (a) The postcraniotomy, cranial surface can be visualized with the laser range scan obtained intraoperatively. The cranial surface was scanned again after the tumor was resected, and this laser range scan is shown in (b). The tissue movement was quantified using these scans, and the measured displacement vectors (pre- to intraoperative) are indicated by the blue arrows in (b).

