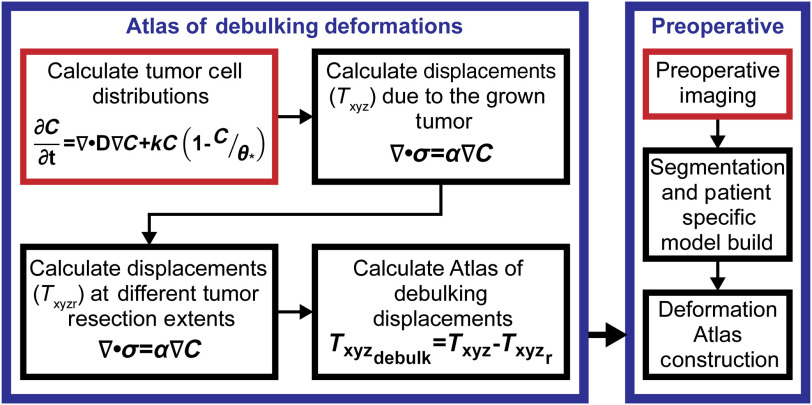
Fig. 3.
The flowchart illustrates the general debulking brain shift prediction methods. The right block in blue illustrates where the atlas of debulking deformations is introduced into the brain shift correction method. The left block in blue is the flowchart of the physics of debulking as described in this study. In the two halves of the flowchart, the red indicates the start of the processes.

