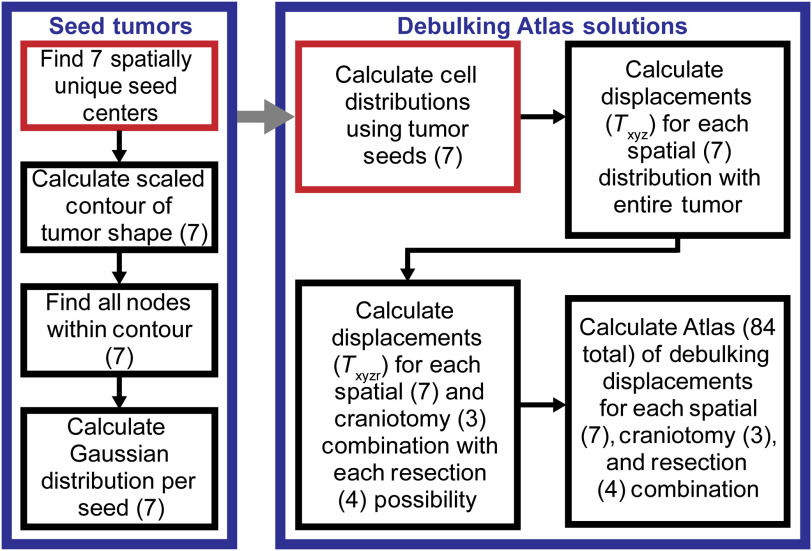
Fig. 4.
The flowchart illustrates the generation of the debulking atlas solutions. The right block in blue reflects the range of possible deformations captured by the atlas. The left block in blue shows how the seven possible tumors were seeded. The red indicates the start of the processes, and the gray arrow shows how the seed tumor block fits into the debulking atlas solutions block. Each number () represents the number of variations for a given step.

