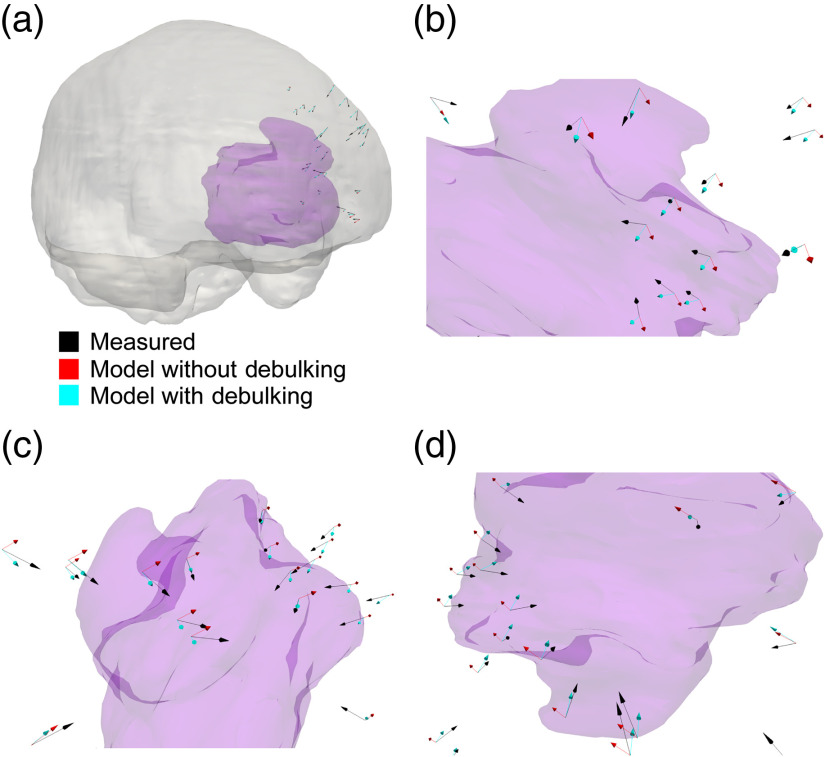
Fig. 7.
The results of patient 4. The opaque purple structure in all panels is the tumor in patient 4. (a) The tumor relative to the brain (opaque grey) can be visualized. (b)–(d) Portions of the tumor and the arrows at various angles and magnifications. In all of the panels, the black arrows are the measured deformations, the red arrows are the estimated deformations when no debulking was included in the atlas, and the cyan arrows are the estimated deformations when the debulking solutions were included in the atlas of solutions for the reconstruction. The size of the arrows is proportional to the magnitude of the deformation.

