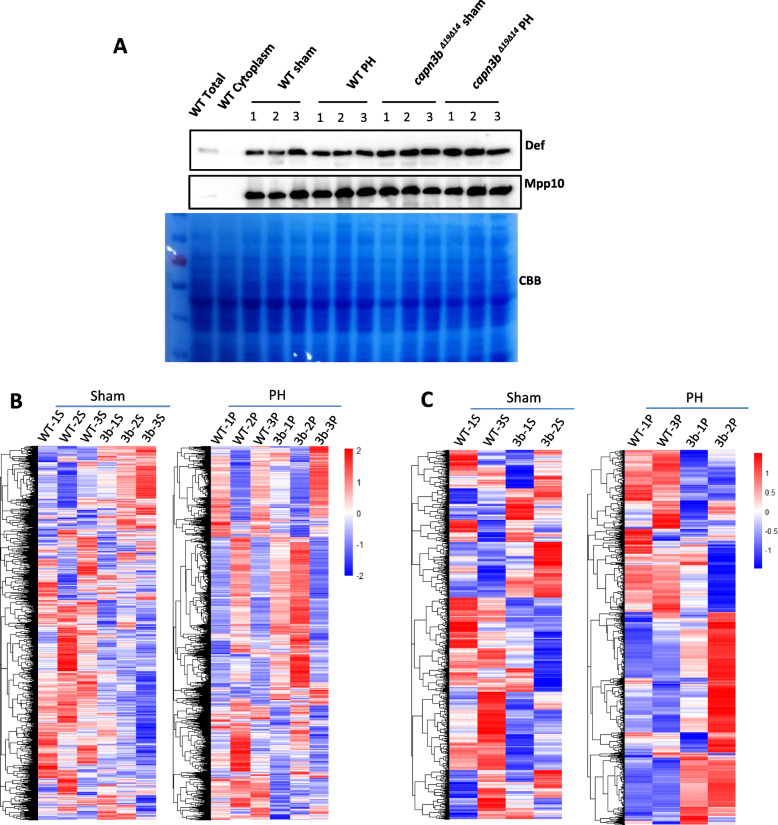
Fig. 5.
Clustering analysis of the mass spectrometry data of nuclear proteins from WT and capn3bΔ19Δ14 samples. a Western blot analysis of protein in the isolated nuclei from WT sham, WT PH, capn3bΔ19Δ14 sham and capn3bΔ19Δ14 PH, three repeats for each group, for each repeat the livers from eight female fish were used. b Heat map clustering analysis of three independent WT sham samples (WT-1S, WT-2S, WT-3S) and three independent capn3bΔ19Δ14 mutant sham samples (3b-1S, 3b-2S, 3b-3S) (left panel), and of three independent WT PH samples (WT-1P, WT-2P, WT-3P) and three independent capn3bΔ19Δ14 mutant PH samples (3b-1P, 3b-2P, 3b-3P) (right panel). Each repeat contained nuclear proteins extracted from 8 female fish. c Heat map clustering analysis of WT-1S, WT-3S, 3b-1S and 3b-2S (left panel), and of WT-1P, WT-3P, 3b-1P, 3b-2P (right panel)

