Figure 5.

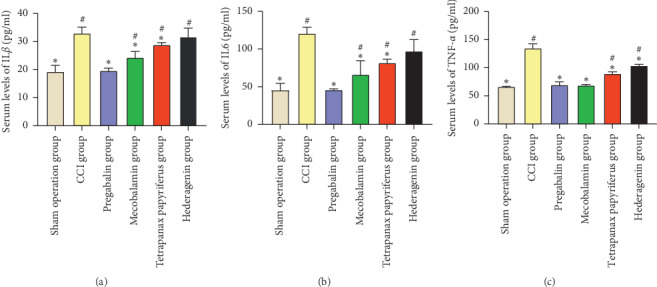
Serum IL6, IL1β, and TNF-α levels. #The contrast of the sham operation group and the other groups. ∗Comparison of the CCI group and the other groups.

Serum IL6, IL1β, and TNF-α levels. #The contrast of the sham operation group and the other groups. ∗Comparison of the CCI group and the other groups.