Figure 1.

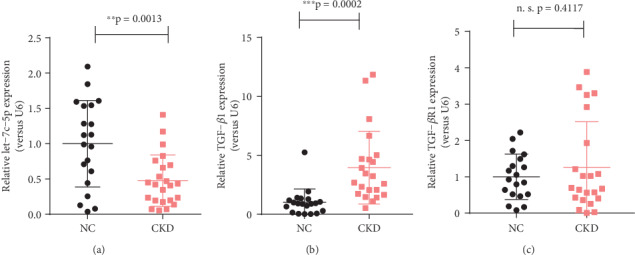
Dot-plots present the distribution of normalized expressions of (a) hsa-let-7c-5p, (b) TGF-β1, and (c) TGF-βR1 between CKD tissues (n = 23) and healthy control samples (n = 20). ∗∗p < 0.01; ∗∗∗p < 0.001; n.s.: not significant.

Dot-plots present the distribution of normalized expressions of (a) hsa-let-7c-5p, (b) TGF-β1, and (c) TGF-βR1 between CKD tissues (n = 23) and healthy control samples (n = 20). ∗∗p < 0.01; ∗∗∗p < 0.001; n.s.: not significant.