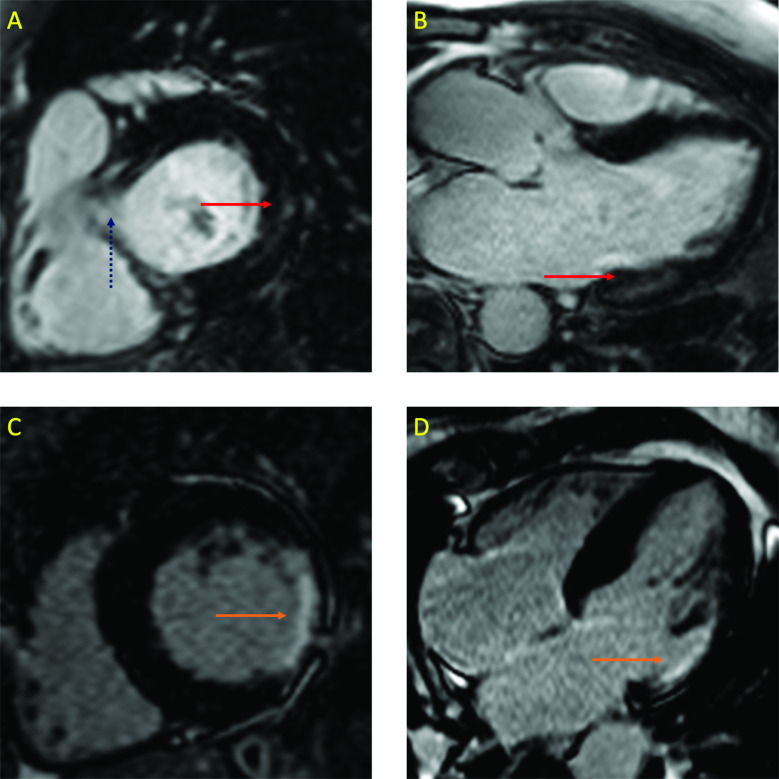
Figure 4.
LGE on CMR imaging. Panels A and B are short axis and three-chamber views of a patient with aortic stenosis. The red arrows indicate focal, non-ischaemic (mid-wall) LGE in the basal inferolateral wall. The dotted blue arrow in panel A indicates the left ventricular outflow tract, where caution must be taken in interpreting contrast enhancement due to partial volume effects. in contrast, panels C and D are the same views of a different patient with a myocardial infarction involving the same segments (orange arrows). Note the transmural pattern and wall thinning. LGE, Late gadolinium enhancement; CMR, cardiac magnetic resonance.

