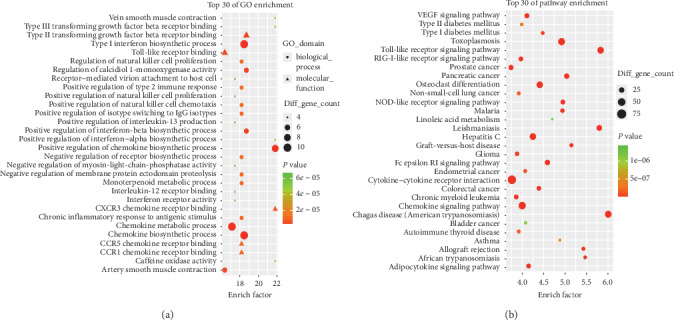
Figure 8.

GO and pathway analysis of the targets of common targets. (a) The top 30 significant GO terms. (b) The top 30 signaling pathways. The different colors from green to red represent the P value. The different sizes of the shapes represent the gene count number. The larger the proportion is, the larger the dot; the redder the dot color, the more significant the P value.
