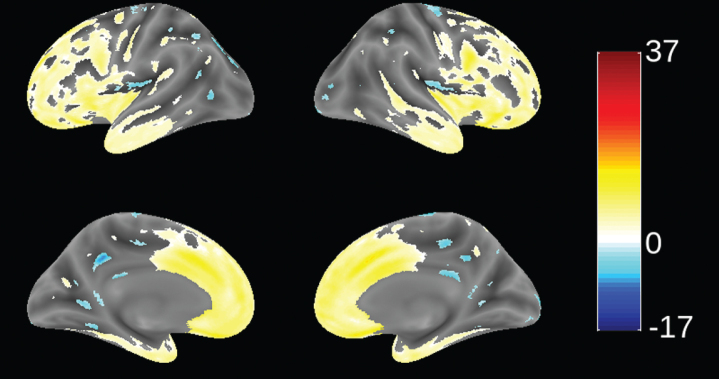
Fig.2.
Voxel-based morphometric comparison showing regions of greater atrophy (yellow) in patients with bvFTD compared to AD patients with mild AD (n = 713), from study TRx-237-005, controlled for age, sex, and total intracranial volume of each individual. Blue color indicates greater atrophy in AD patients. Data are displayed at a significance threshold corrected for family-wise error at the whole brain level at p < 0.05.

