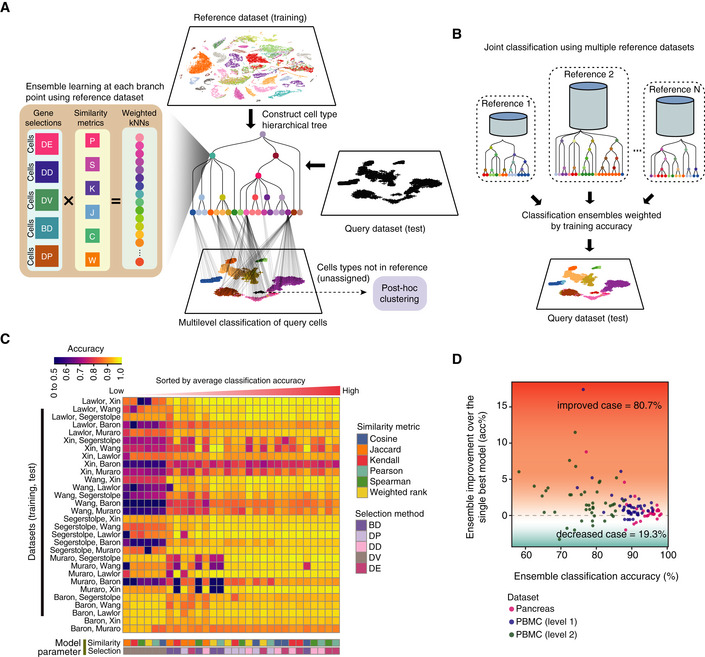
Figure 1. scClassify framework and ensemble model construction (see also Fig EV1).

- Schematic illustration of the scClassify framework. Gene selections: DE, differentially expressed; DD, differentially distributed; DV, differentially variable; BD, bimodally distributed; DP, differentially expressed proportions. Similarity metrics: P, Pearson's correlation; S, Spearman's correlation; K, Kendall's correlation; J, Jaccard distance; C, cosine distance; W, weighted rank correlation.
- Schematic illustration of the joint classification using multiple reference datasets.
- Classification accuracy of all pairs of reference and test datasets was calculated using all combinations of six similarity metrics and five gene selection methods.
- Improvement in classification accuracy after applying an ensemble learning model over the best single model (i.e. weighted kNN + Pearson + DE).
