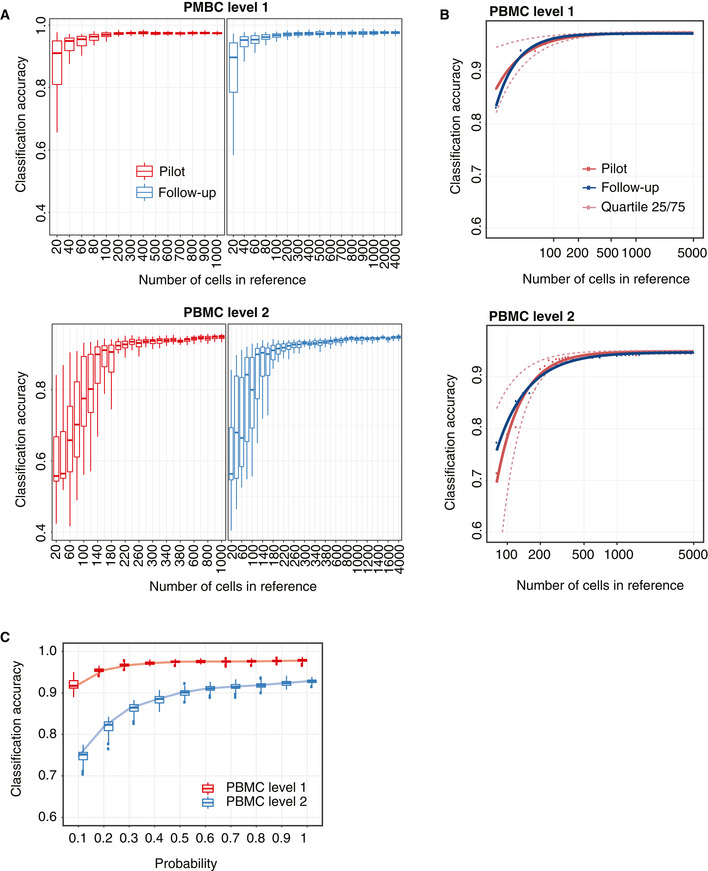
Figure EV3. Sample size estimation results. Related to Fig 3 .

- A 2‐by‐2 panel of collections of boxplots demonstrating the validation of the sample size calculation using the PBMC10k dataset. The x‐axis indicates the sample size (N), and the y‐axis indicates the accuracy rate. The left panel indicates the results for the pilot data (20% of the full dataset), and the right panel indicates the results for the reference–test data (the remaining 80% data), representing the data that would be obtained in a follow‐up experiment. The top panel indicates the results of predicting PBMC at the top level of the cell type tree, while the bottom panel indicates the results of cell type prediction at the second level of the cell type tree. Each boxplot ranges from the first to third quartile of classification accuracy with the median as the horizontal line. The lower and higher whiskers of boxplot are extended to the first quartile minus 1.5 interquartile range and the third quartile plus 1.5 interquartile, respectively.
- The fitted learning curves on the same data where red solid lines indicate the learning curves by fitting mean accuracy rate of pilot data; red dashed lines are the learning curves obtained by fitting the learning curves to the upper (75%) and lower (25%) quartile of accuracy rate of pilot data. The blue lines indicate the learning curves by fitting the mean of the accuracy rate for the follow‐up reference and test dataset.
- Down‐sampling of the PBMC10k data using DECENT's beta‐binomial capture model (Ye et al, 2019). Boxplots indicate the accuracy rates of the cell predictions from down‐sampled data for the top (red) and second level (blue) of the cell type tree. Each boxplot ranges from the first to third quartile of classification accuracy with the median as the horizontal line. The lower and higher whiskers of boxplot are extended to the first quartile minus 1.5 interquartile range and the third quartile plus 1.5 interquartile, respectively. The x‐axis indicates the down‐sampling parameter of the beta‐binomial distribution (that is, the ratio of capture efficiency in the down‐sampled dataset relative to the original dataset), and the y‐axis denotes the accuracy rate.
