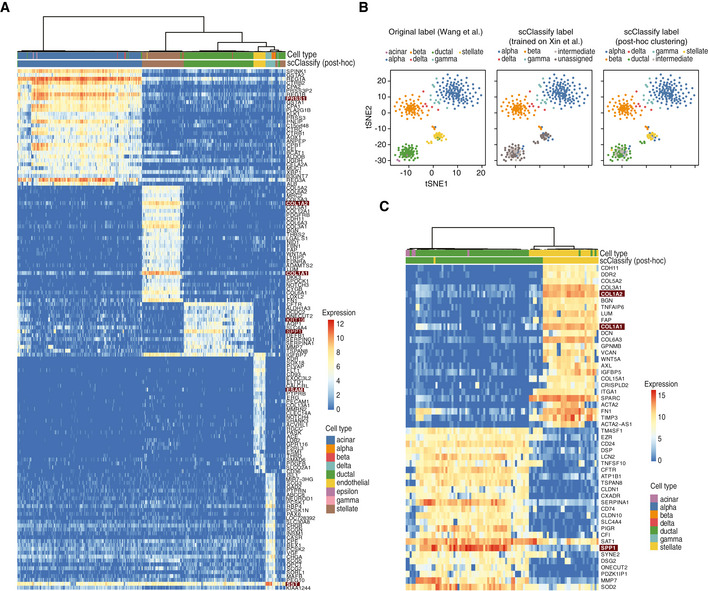
Figure EV4. Post hoc clustering and validation by marker genes. Related to Fig 4 .

- Heatmap of the top 20 differentially expressed genes from each of the five cell type clusters generated through post hoc clustering of the Xin‐Muraro data pair. Here, Xin et al data are used as the reference dataset and Muraro et al data as the query dataset. The heatmap is coloured by the log‐transformed expression values. The red rectangles indicate markers that are consistent with those found in the original study.
- A 1‐by‐3 panel of tSNE plots of Wang et al from the human pancreas data collection colour‐coded by original cell types given in Wang et al (2016) (left panel), the scClassify label generated using Xin et al as the reference dataset (middle panel) and the scClassify predicted cell types after performing post hoc clustering (right panel).
- Heatmap of the top 20 differentially expressed genes from each of the two cell type clusters generated from post hoc clustering of the Xin‐Wang data pair. The heatmap is colour‐coded by the log‐transformed expression level. The red rectangles indicate markers that are consistent with those found in the original study.
