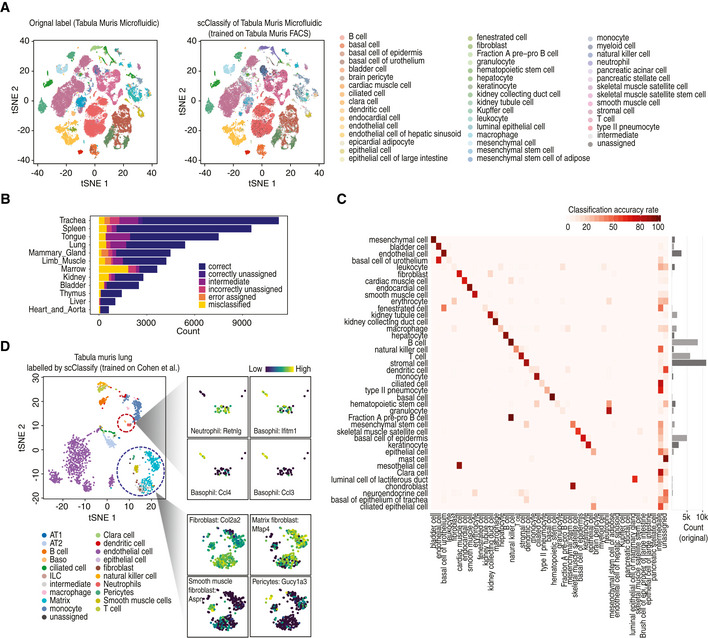
Figure 5. Cross‐platform classification of cell types using scClassify.

- tSNE visualisation of the Tabula Muris Microfluidic dataset (The Tabula Muris Consortium, 2018; Data ref: The Tabula Muris Consortium 2018). Cell typing is based on either the original publication (left panel) or scClassify prediction (right panel). scClassify was applied to the Tabula Muris Microfluidic data collection with the Tabula Muris FACS dataset as reference data for model training.
- Bar plot indicating the predicted cell types organised by tissue types when the Tabula Muris Microfluidic dataset was used as query and the Tabula Muris FACS dataset was used as reference.
- Heatmap of data in (A) comparing the original cell types given in the Tabula Muris Microfluidic data (rows) against the scClassify predicted cell types (columns) generated using the Tabula Muris FACS data as the reference dataset.
- scClassify prediction results of cells in lung tissue type in the Tabula Muris FACS data by using Cohen et al dataset as reference (Cohen et al, 2018; Data ref: Cohen et al, 2018). The large tSNE plot is the full data coloured by scClassify predicted cell types, while the smaller tSNE panels show two subsets of cells from the large plot, each coloured to highlight four marker genes, where the lighter yellow colour represents higher gene expression.
