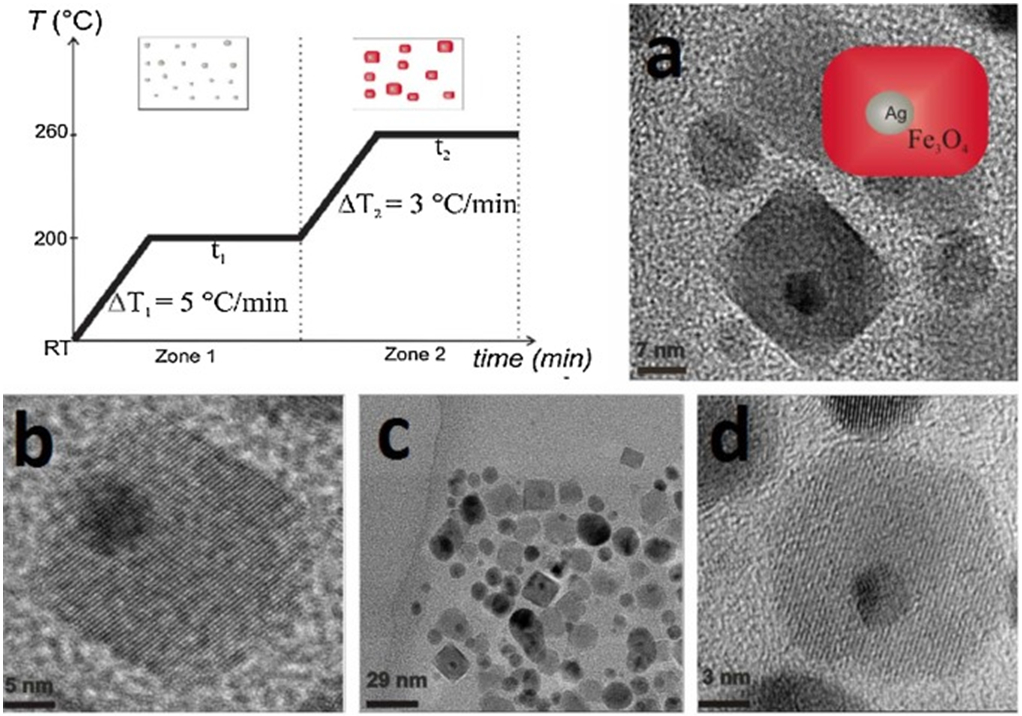
Figure 2.

Temperature profile of the temperature-paused single-step thermal decomposition synthesis. Boxes sketch the expected predominant structures for each time zone. Typically, both waiting times are 120 min. Images: TEM images of brick-like nanoparticles (BLNs) obtained following the temperature-paused single-step protocol. Ag corresponds to the dark contrast, while lighter particles correspond to magnetite. Plain magnetite nanoparticles which are formed are also shown in (c). (a, b and d) are different amplifications of BLNs in order to understand the structure. Reprinted from Ref. [62]. Copyright 2015 American Scientific Publishers.
