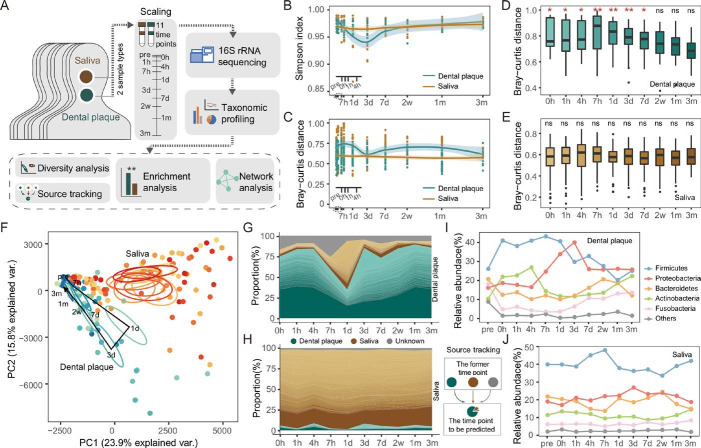
Figure 1.
Longitudinal dynamics of in vivo human oral microbiota. (A) Overview of the study design and sample collection. (B) The alpha diversity of the dental plaque and salivary microbiota over time. The shadow around the line shows a 95% CI. (C) The Bray-Curtis distance calculated at the operational taxonomic unit (OTU) level across individual microbiota of the same time point. (D–E) The Bray-Curtis distance between microbiota of each time point and pre. Significance was measured using Wilcoxon rank-sum test (0.01>p>0.001, **; 0.05>p>0.01, *; p>0.05, ns). (F) The principal component (PC) analysis of dental plaque and saliva microbiota at each time point. The circle shows a 10% CI. (G–H) Tracing the source of OTUs in each time point. The dental plaque and saliva samples of the former time point were taken as potential sources of the latter time point. The bands of each colour indicate the top 100 most abundant OTUs. Green, brown and grey bands represent the sources of dental plaque, salivary and unknown, respectively. (I–J) The temporal changes of bacterial abundance at the phylum level.

