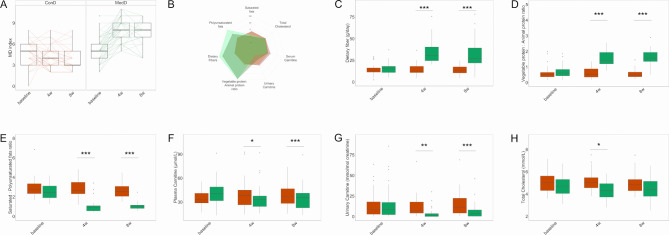
Figure 1.
Adherence to the Mediterranean diet (MD) and changes in dietary and metabolic variables. (A) Box plots showing MD index score for controls (ConD) or treated subjects (MedD) during the intervention, the significance was tested by applying the post hoc Friedman-Nemenyi test for pairwise test of multiple comparisons within each group. (B) Percentage changes in dietary and metabolic variables are represented as spider chart. Changes in levels of dietary components consumption including (C) dietary fibre, (D) vegetable proteins/animal proteins ratio, (E) saturated to polyunsaturated fats ratio. Reduction in serum and urinary markers such as (F) plasma carnitine, (G) urinary carnitine and (H) total cholesterol. The significance was tested by applying unpaired Wilcoxon rank-sum tests for variation at the specific time point compared with baseline in MedD versus ConD. Orange boxes refer to controls and green boxes to Mediterranean subjects, respectively. Baseline, 0 weeks; 4w, 4 weeks; 8w, 8 weeks of nutritional intervention (*p<0.05, **p<0.01 and ***p<0.001).

