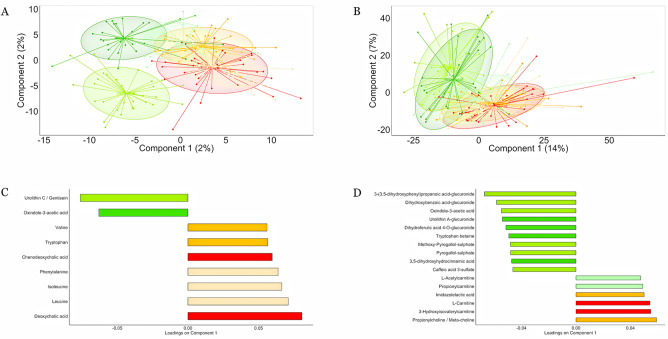
Figure 2.
Mediterranean diet changes the intestinal and systemic metabolome. Partial least squares discriminant analysis plots based on molecular features detected in (A) faeces and (B) urine. Subjects belonging to different categories were coloured according to diet and time points: MedD subjects at baseline (light green), after 4 weeks (green) and 8 weeks of intervention (dark green). ConD subjects at baseline (light orange), after 4 weeks (orange) and 8 weeks (dark orange) of intervention. The loading plots display vectors that contributed the most to variability of individual dataset; variables explaining the variance between the groups in (C) faecal and (D) urine metabolome are reported as bar plots.

