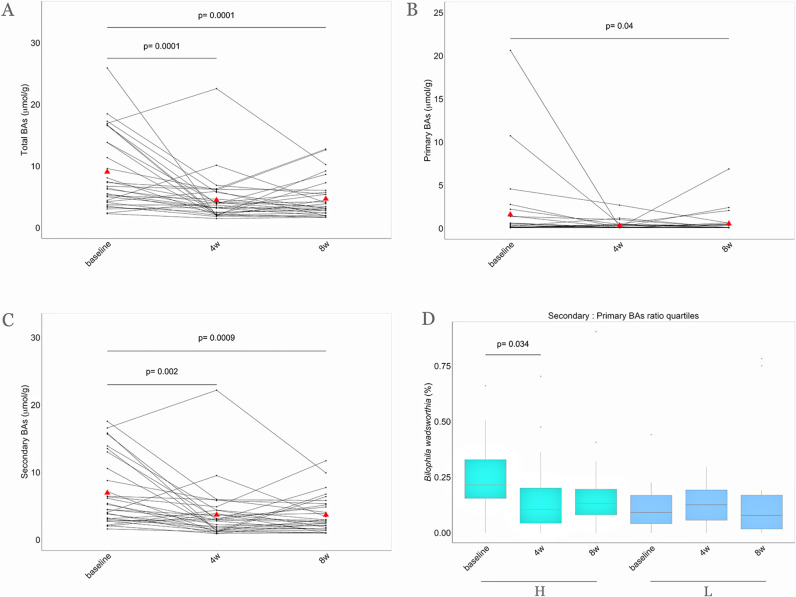
Figure 5.
Faecal BA concentrations over the nutritional intervention. Parallel coordinate plot showing variations of faecal (A) total, (B) primary and (C) secondary BA concentrations within the MedD group during the intervention. The red triangles indicate mean values, the lines connecting dots are used to indicate the same sample at each time point. The significance was tested by applying the post hoc Friedman-Nemenyi test for pairwise test of multiple comparisons within each group. (D) In the box plot the relative abundances of Bilophila wadsworthia are compared considering subjects falling in the highest quartile (n=16, green) and in the lowest quartile of reduction (n=16, blue) of secondary to primary BAs ratio after 4 weeks of treatment. Baseline, 0 weeks; 4w, 4 weeks; 8w, 8 weeks of nutritional intervention. H, highest quartile of reduction; L, lowest quartile of reduction; BAs, bile acids.

