Figure 6.
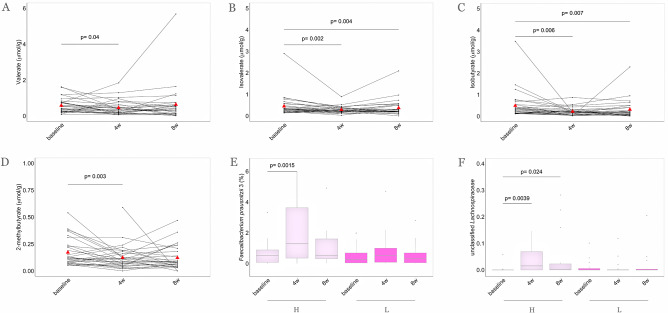
MD intervention determines a reduction of faecal branched-chain fatty acid (BCFA) concentrations and higher levels of Faecalibacterium prausnitzii and Lachnospiraceae taxa. Parallel coordinate plot showing variations of (A) valerate, (B) isovalerate, (C) isobutyrate and (D) 2-methylbutyrate faecal concentrations within MedD population. The red triangles indicate mean values, the lines connecting dots are used to indicate the same sample at each time point. The significance was tested by applying the post hoc Friedman-Nemenyi test for pairwise test of multiple comparisons within each group. In the box plots, the relative abundances of (E) F. prausnitzii 3 and (F) Lachnospiraceae family are compared considering subjects falling in the highest quartile (n=16, violet) and in the lowest quartile (n=16, purple) of faecal butyrate increase after 4 weeks of treatment. Statistical differences between groups were determined using Wilcoxon rank-sum tests. Baseline, 0 weeks; 4w, 4 weeks; 8w, 8 weeks of intervention. H, highest quartile of increase; L, lowest quartile of increase.

