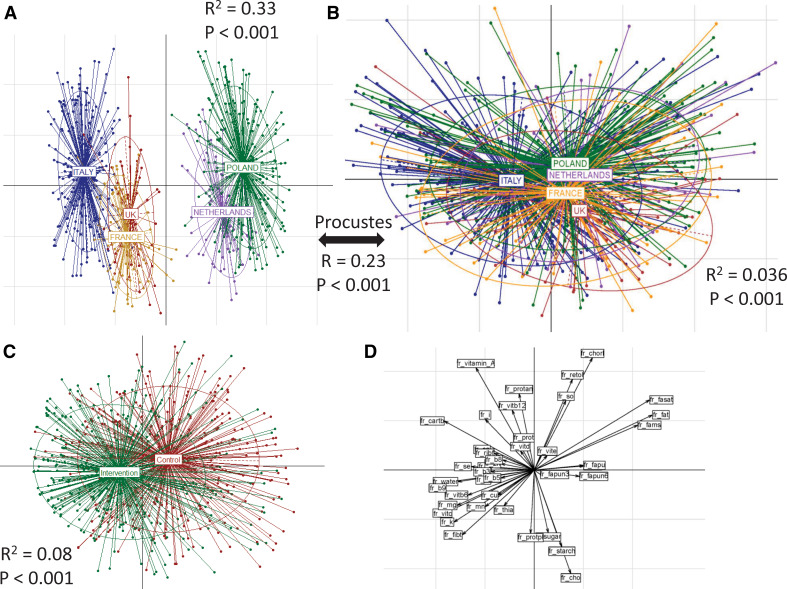
Figure 1.
Baseline habitual diet and microbiota composition separate and co-vary by country, and the dietary intervention altered macronutrient profiles. Principal component analysis (PCoA) plots of (A) baseline dietary profiles and (B) baseline 16S microbiome profiles across the five different countries. For both, the PERMANOVA p values showing the significance of the association with the countries are also indicated. For the association between the dietary frequencies, the microbiome profiles, R2 and the significance values obtained using the Procrustes analysis are also shown. The results indicate that there are country-specific patterns in dietary habits which are also reflected in the microbiome profiles. (C) PCoA plots showing the distinct variations in the dietary patterns in the intervention and control cohorts. The PERMANOVA p values of these differences are also indicated. This reflects the effect of the dietary intervention to detect the specific dietary components driving these effects. Associations were computed between the intake frequencies of the components and the two PCoA axes (PCoA1 and PCoA2). These associations are plotted in (D). While the intervention group is primarily driven by an increase in consumption of fibres, vitamins (C, B6, B9, thiamine) and minerals (Cu, K, Fe, Mn, Mg), the changes in controls are associated with an increase in fats consumption.

