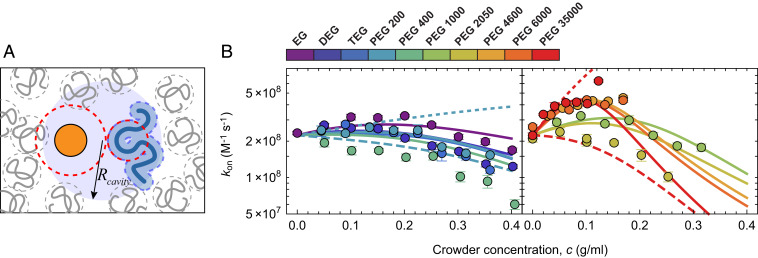
Fig. 4.
Depletion effects on the association rate coefficient. (A) Schematic depiction of NCBD (orange) and ACTR (blue) within a cavity formed by the crowder molecules. Inside the cavity, the proteins diffuse with the diffusion coefficient in pure solvent, outside with a reduced relative diffusion coefficient. Within the cavity, the proteins experience an attractive interaction due to the osmotic pressure of the crowders. (B) Measured association rate coefficients, (filled circles), with global fit using Eq. 6 (lines) as a function of the concentration of PEGs of different size (see color scale) using the values of ΔΔG from the fits in Fig. 2E. For clarity, the dataset is split in two: the left shows PEGs up to 400 g/mol and the right 1,000 g/mol and above. The counteracting effects of depletion attraction (short-dashed lines) and viscosity (long-dashed lines) predicted by Eq. 6 are illustrated for PEG 200 (Left) and PEG 35000 (Right).

