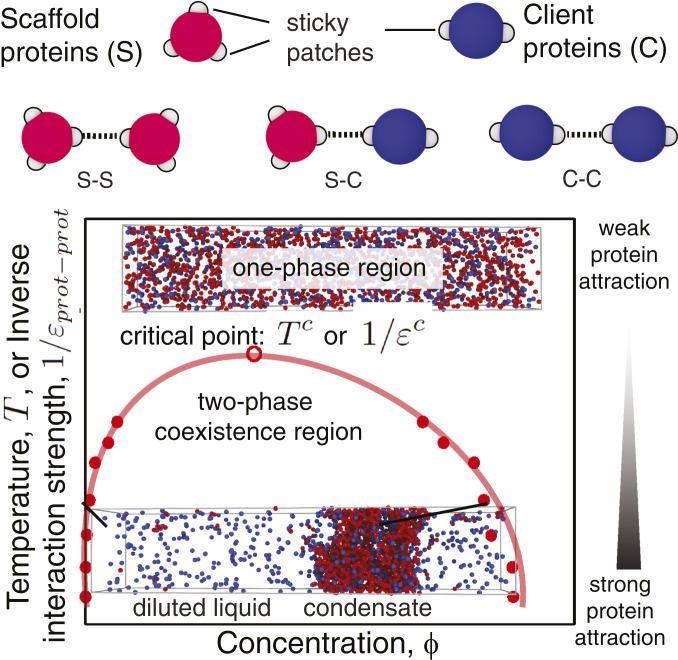
Fig. 1.
Graphical illustration of the minimal coarse-grained protein model used in this work (Top) and a representation of a typical phase diagram as a function of the (inverse) interaction strength (Bottom). Proteins (scaffolds and clients) are represented as hard-sphere cores (red for scaffolds and blue for clients) with attractive sites on their surface (gray patches). Each patch allows the protein to engage in one weak attractive protein–protein interaction. The phase diagrams explore the space of (inverse) protein–protein interaction strengths (; vertical axis) or equivalently temperature (, since ) versus volume fractions (; horizontal axis). For a given value of , if two phases are detected, we measure the volume fractions () of the proteins in the different phases and use this information to plot a coexistence curve. The volume fraction is defined as the fraction of the volume of a phase () that is occupied by proteins: , where is the volume of the hard core of protein of type and is the total number of proteins of type in a given phase. is the number density of proteins of type in that phase. The coexistence curve (shown in red) is useful when assessing the propensity of a protein to phase separate because it shows for what values of the protein–protein interaction strength (vertical axis) and for what protein concentration (horizontal axis) demixing will occur. The region above the coexistence curve is the “one-phase region,” where protein–protein interactions are too weak to sustain phase separation (top snapshot of a well-mixed homogeneous phase). The region below the coexistence curve, the “two-phase coexistence region,” represents stronger protein–protein interactions that favor demixing into a condensed (protein-enriched) and a diluted (protein-depleted) liquid phase (bottom snapshot of a demixed system). The maximum in the coexistence curve is known as the critical point ( or ): For interaction strengths lower than the critical value, liquid–liquid phase separation is no longer observed. If, in a simulation, the interaction strength exceeds the critical value, liquid–liquid phase separation occurs spontaneously.

