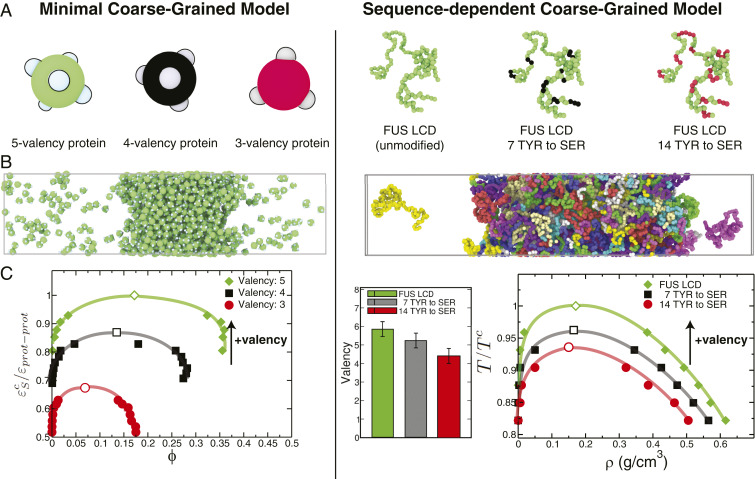
Fig. 2.
Impact of protein valency modulation in their phase behavior as predicted by the minimal coarse-grained protein model used in this work (A–C, Left) and the realistic residue-resolution sequence-dependent protein model of Dignon et al. (52) (A–C, Right). (A, Left) Schematic illustration of proteins with three different valencies (green, 5-valency; black, 4-valency; and red, 3-valency) modeled as patchy particles. (A, Right) The low-complexity domain (residues 1 to 163) of the human FUS protein (green, unmodified FUS LCD), FUS LCD with 7 of its tyrosine (TYR) residues mutated to serine (SER) (green with black spheres highlighting the mutated TYR) and with 14 of its TYR residues mutated to SER (green with red spheres highlighting the mutated TYR). (B) Simulation snapshots illustrating the coexistence of condensed and diluted liquid phases. (C, Left) Phase diagrams (inverse protein–protein interaction strengths, , versus volume fraction, ) for the three minimal proteins. (C, Right) Average valency (SI Appendix, section V) and liquid–liquid phase diagrams (temperature, , versus density, ) for the three FUS LCD proteins studied. The vertical axes in C have been normalized by the critical point of the highest-valency protein in each set (Left, for the 5-valency protein; Right, for the unmodified FUS LCD). The black arrows indicate the direction toward which the critical parameters ( or ) move upon an increase in valency. Error bars in the phase diagrams are of the same size as or smaller than the symbols. Typical statistical uncertainties are provided in SI Appendix, Table S5.

