Fig. 5.
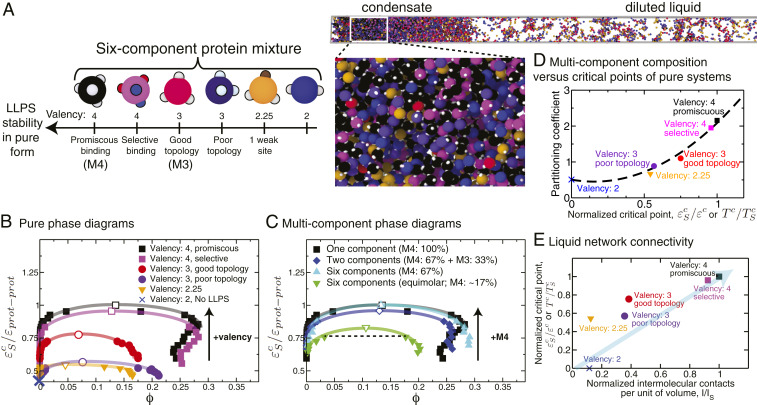
Phase behavior of biomolecular condensates with up to six different types of phase-separating proteins. (A, Left) Cartoon illustrating types of proteins in the mixtures: two types of 4-valency proteins (promiscuous, which we term “M4,” and selective), two types of 3-valency proteins (good, which we term “M3,” and poor topology), a 3-valency protein with one binding site partially deactivated (1/4; 2.25-valency), and a 2-valency protein. The 4-valency promiscuous protein has the largest coexistence region and highest critical temperature and dominates the phase behavior of the mixture. (A, Right) Simulation snapshot showing liquid–liquid coexistence of a six-component equimolar mixture. (B) Phase diagrams of the single-component protein systems showing how the critical point varies with the protein characteristics. The vertical axes in all of the phase diagrams represent the inverse interaction strength normalized by the critical value of the single-component scaffold ( for the 4-valency promiscuous protein). Note that because 2-valency proteins do not undergo LLPS on their own, a coexistence curve is not shown for such a system. The black arrow indicates the direction of change of the critical parameter as the valency increases. Numerical values of these single-component critical points are given in SI Appendix, Table S2. (C) Phase diagram of a six-component mixture at two different mixing concentrations versus a binary mixture. The binary mixture (blue diamonds) contains 67% 4-valency promiscuous proteins and 33% 3-valency good-topology proteins. The first six-component mixture (cyan triangles) contains 67% 4-valency promiscuous proteins and 33% remaining proteins at equal concentrations (6.6% each). The second six-component mixture (green inverted triangles) is an equimolar mixture, i.e., formed by equal concentrations of all proteins (16.6% each). The black arrow indicates the direction of change of the critical parameter as the concentration of the highest-valency protein in the mixture (in this case M4) increases. Numerical values of the critical points for these systems are given in SI Appendix, Tables S2 and S3. (D) Partitioning coefficient as a function of the normalized critical point (critical inverse interaction energy of each protein in pure form divided over the highest critical value among the set (that for the 4-valency proteins) or, equivalently, critical temperatures of each protein in pure form divided over the highest critical temperature among the set). The partitioning coefficients (defined here as the natural logarithm of the ratio of concentration of a protein in the condensate versus the diluted liquid) were calculated for the equimolar mixture at a constant value of the normalized inverse interaction energy (0.75) depicted by a dotted line in C. (E) Normalized critical points for the proteins in pure form (as defined as in D) plotted as a function of the normalized number of intermolecular protein–protein contacts per unit volume () calculated for each independent system in pure form at a constant value of and finite pressure (SI Appendix, section VIII). The normalization was done by dividing over the highest number of contacts established by a protein in the mixture (the 4-valency protein). Error bars in the phase diagrams are of the same size as or smaller than the symbols. Typical statistical uncertainties are provided in SI Appendix, Table S5.

