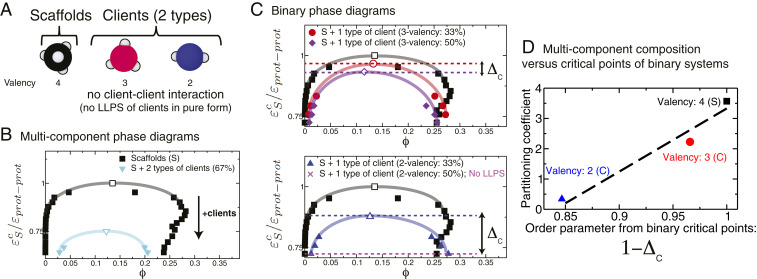
Fig. 6.
Phase behavior of biomolecular condensates with one type of scaffold and two types of client proteins that do not undergo LLPS in pure form. (A) The scaffold is a 4-valency protein that self-interacts and drives LLPS. The two types of clients are 3-valency and 2-valency proteins that exhibit only scaffold–client interactions (no client–client interactions) and can phase separate only when mixed with the scaffolds. (B) Phase diagram of the equimolar multicomponent mixture versus that of the pure scaffold. The black arrow indicates the direction toward which the critical parameter moves upon addition of clients. Numerical values of the critical points of these systems are given in SI Appendix, Table S4. (C) Phase diagrams of binary mixtures consisting of the scaffolds and one type of client each (Top, 3-valency clients; Bottom, 2-valency clients) at two different scaffold–client ratios (33 and 50 clients). For each type of client, we define the parameter as the difference in the normalized critical points of the binary scaffold–client mixture at two client concentrations, i.e., , where the subscripts Low and High indicate that the critical point is taken from the low (e.g., 33) and high (e.g., 50) client concentrations, respectively. For systems where increasing the client concentrations results in LLPS inhibition (e.g., scaffold–client mixture with 50 of 2-valency clients), we define instead as , where is the lowest temperature or largest protein–protein interaction strength that we can explore without observing gelation. Consistent with this definition, for the scaffolds is always equal to zero. The horizontal dashed lines indicate the values of (red) and (purple) for the 3-valency clients, and (blue) and (magenta) for the 2-valency clients. The double-headed arrows illustrate the values of . (D) Partitioning coefficient of the different species in the equimolar mixture versus the order parameter determined from the critical points of the different binary mixtures. Error bars in the phase diagrams are of the same size as or smaller than the symbols. Typical statistical uncertainties are provided in SI Appendix, Table S5.

