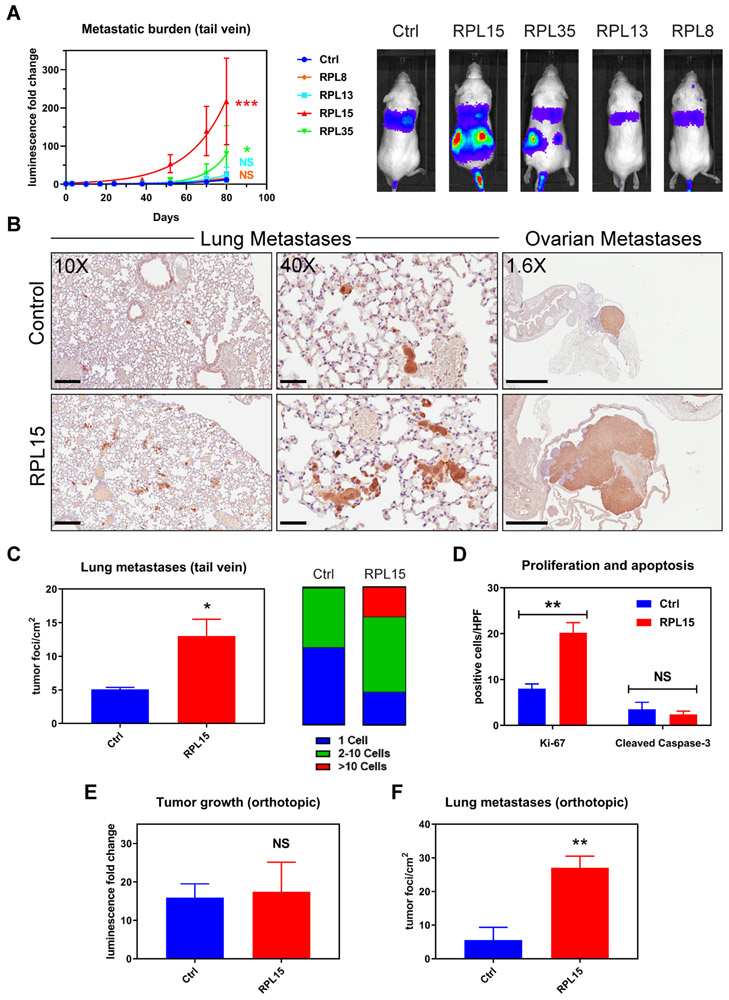
Fig. 2. Validation of pro-metastatic effect of RPL15 overexpression.
(A) Left panel: Whole body luminescence monitoring of NSG mice injected via tail vein with CTCs overexpressing RPL8, RPL13, RPL15, or RPL35 (n = 4 mice per group). Curve fit by least squares method. P values calculated by the extra sum-of-squares F test. Right panel: Representative images of the bioluminescent signal one month after injection. (B) Representative sections of lung (left and middle panels) and ovarian (right panel) histology after staining with anti-GFP antibody (brown) and counter-stained with hematoxylin. Average long axis diameter of ovarian metastases in mice injected with RPL15-CTCs vs control: 9.1mm vs 2.4 mm respectively. Scale bars: Left panel 200μm; Middle panel 50μm; Right panel 2mm. (C) Quantitation of the number and size of tumor foci per cm2 identified by anti-GFP staining of lung histologic sections from mice injected with RPL15-CTCs or control. (D) Quantitation of the number of cells positive for Ki-67 or cleaved caspase-3 per high powered field by immunohistochemical staining of ovarian histologic sections. (E) Fold change in tumor bioluminescence after mammary fat pad injections of RPL15-CTCs or control at the terminal time point of day 78 (n = 4 mice per group, 2 tumors per mouse). (F) Quantitation of the number of tumor foci per cm2 identified by anti-GFP staining of lung histologic sections from mice after orthotopic injection of RPL15-CTCs or control. Error bars represent SEM. P values calculated by two-tailed unpaired Student’s t test. ***: p<0.001, **: p<0.01 *: p<0.05, NS: p>0.05.

