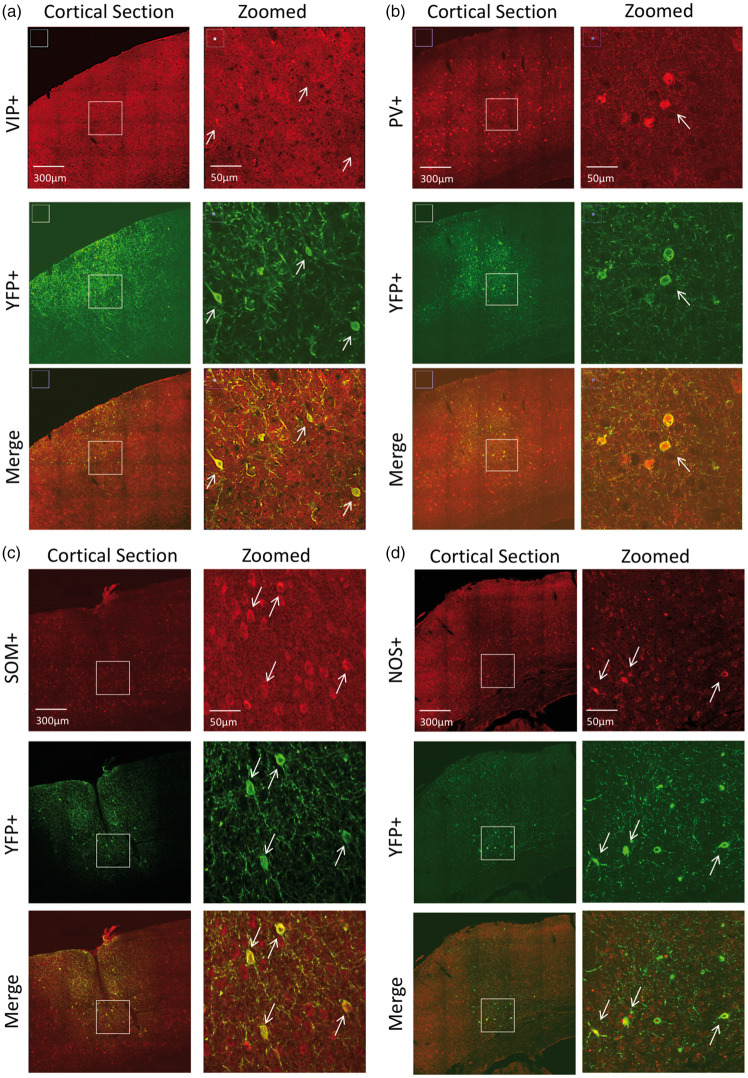
Figure 3.
Confocal images of immunostained brain sections from (a) VIP-cre, (b) PV-cre, (c) SOM-cre and (d) NOS-cre mice. For each mouse, larger field-of-view images are shown on the left panels and zoomed images on the right panels (white rectangle on left panels shows zoomed location for images on the right panels). The top panels show staining for the model of interest (red), middle panels show staining for ChR2-YFP (green) and the bottom panels show color merge images. White arrows show location-matched cells between zoomed panels from the same mice.

