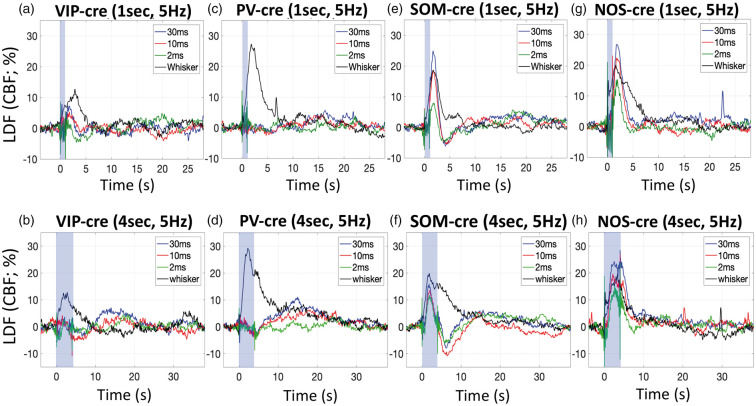
Figure 4.
Average CBF changes measured by LDF in response to photo-stimulation for 1 s at 5 Hz and various pulse widths (30 ms in blue traces, 10 ms in red traces, 2 ms in green traces), as well as whisker stimulation (black traces) in VIP-cre (a), PV-cre (c), SOM-cre (e) and NOS-cre (g) mice. Similarly, average CBF changes in response to photo-stimulation and whisker for 4 s in VIP-cre (b), PV-cre (d), SOM-cre (f) and NOS-cre (h) mice. The photo-stimulus amplitude was fixed to 1 mW. The shaded blue rectangle denotes the photo-stimulation period. For reference, the average time-to-peak for CBF responses evoked by 1-s whisker stimulation were 3.0 ± 2.0, 2.4 ± 1.1, 2.7 ± 1.7 and 2.4 ± 1.2 s for VIP-cre, PV-cre, SOM-cre and NOS-cre models, respectively, and 2.7 ± 1.6, 3.0 ± 1.2, 3.5 ± 2.1 and 2.4 ± 0.9 s to 4-s stimulation in these models, respectively.

