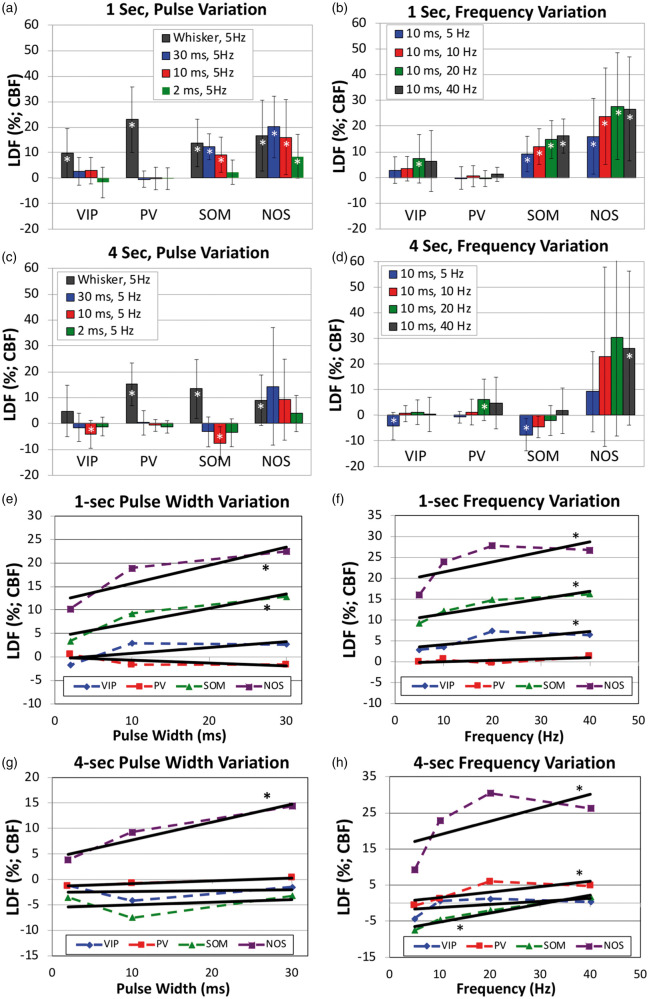
Figure 5.
Summary of the changes in CBF evoked by photo-stimulation in the different transgenic mouse models used (VIP-cre, PV-cre, SOM-cre and NOS-cre). Error bars denote standard error. Since typical vascular responses evoked by stimulation peak several seconds after stimulation onset, we measured CBF changes 2–4 s after onset for 1-s stimulation (panels a, b, e and f) and 4–7 s after onset for 4-s stimulation (panels c, d, g and h). Significant differences from baseline are denoted by (white *, p < 0.05). Linear regression analyses were performed to determine whether significant relationships were observed with respect to the photo-stimulus pulse duration (panels e and g) and frequency (panels f and h). Significant relationships are denoted by a (black *, p < 0.05).

