
Figure 1.
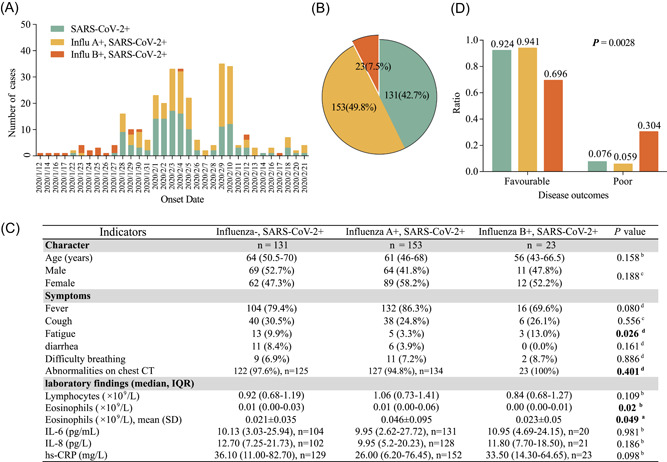
Co‐infection of SARS‐CoV‐2 and influenza viruses among patients. A, Records of daily new cases in a single‐centered study at Tongji hospital (Wuhan, China) from 12 January to 21 February 2020. Flu A: influenza type A virus; Flu B: influenza type B virus. Patients were grouped into SARS‐CoV‐2 single positive (green color), co‐infection with influenza A virus (yellow color) or co‐infection with influenza B virus (red color). B, Number of cases and percentage of each group. C, Character, clinical symptoms and laboratory comparison of patients among these three groups. Continuous variables were described as median and interquartile range (IQR) or mean and standard deviation (SD) and differences were assessed using analysis of variance (ANOVA) or the Kruskal‐Wallis test. Categorical variables were expressed as number (%) and differences between groups were assessed using Pearson's χ 2 test or Fisher's exact test. A, ANOVA; B, the Kruskal‐Wallis test; C, Pearson's χ 2 test; D, Fisher's exact test. P < .05 was bold. n = 131, 153 or 23 individually unless indicated. D, Disease outcomes for patients among three groups. Favorable means disease alleviated or recovered; poor means disease aggravated with certain deaths. The differences between groups were assessed using Pearson's χ 2 test or Fisher's exact test. Hs‐CRP, hypersensitive C‐reactive protein