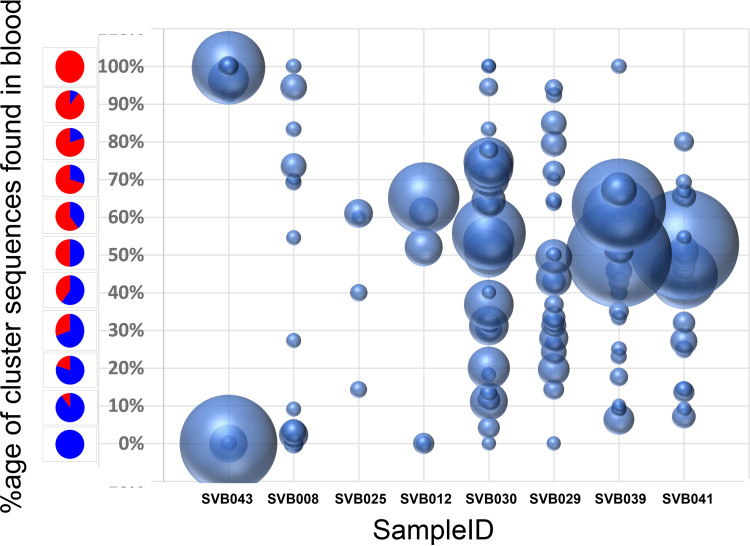
FIG 4.
Some variants were found primarily in one compartment, even in study participants with minimal compartmentalization. Shown are bubble plots for the study subjects who showed clonally amplified clusters at the terminal nodes of phylogenetic trees. The samples are arranged by the extent of blood versus genital tract viral compartmentalization, with SVB043 and SVB041 being the most and least compartmentalized donors, respectively. Each bubble represent a terminal node in a blood-semen phylogenetic tree carrying identical sequences, and the size represent the number of sequences present in that node. The y axis shows the relative composition of either blood or semen sequences in these node clusters, with red and blue representing proportions of blood and semen sequences, respectively. The x axis shows the sample IDs of the study participants whose HIV-1 populations were analyzed. Only clusters of 10 or more sequences were analyzed. Participants SVB021 and SVB026 did not have clusters containing 10 sequences or more, and their results are not shown.

