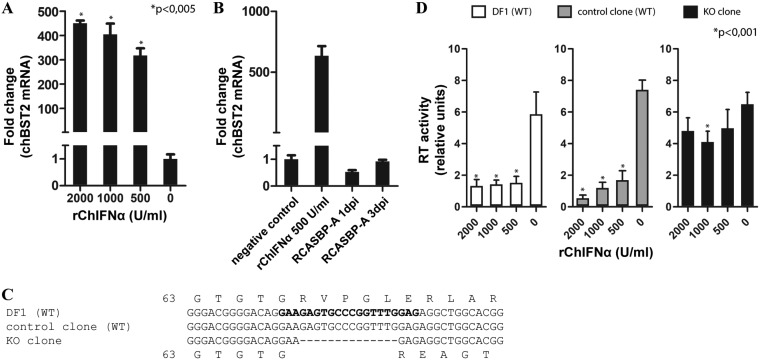
FIG 2.
chBST-2 knockout and analysis of IFN-induced block of ASLV release. (A) DF-1 cells were treated with increasing amounts of rChIFN-α. After 24 h, the medium was exchanged and IFN was added at the same concentration as before. Two days after the first IFN treatment, total RNA from the cells was isolated and used to quantify chBST-2 mRNA expression by qRT-PCR. The data were normalized to chicken GAPDH. (B) DF-1 cells were infected with RCASBP(A)GFP at a multiplicity of infection (MOI) of 1 and harvested for RNA isolation on days 1 or 3 postinfection (dpi). The chBST-2 mRNA expression was determined by qRT-PCR. As positive control, cells treated with rChIFN-α were used. (C) Alignment of chBST-2 sequences around the region targeted by the CRISPR/Cas9 construct (sequences used in the targeting oligonucleotide are in bold type). The 14-bp deletion in the knockout (KO) clone is shown. Predicted amino acid translation starting at glycine 63 is shown for both WT and KO variants. (D) Cells (WT DF-1, control clone, and KO clone) were infected with RCASBP(A) vector and passaged several times to achieve complete virus spread. Each of the three cell types was seeded on 12-well plates and, after 1 h, treated with rChIFN-α at the indicated concentration. After 24 h, the medium was exchanged and rChIFN-α was added at the same concentration as before. Forty-eight hours after cell seeding, the virus-containing cell culture media were harvested and used to quantify the amount of reverse transcriptase activity by the product-enhanced reverse transcriptase (PERT) assay as described in Materials and Methods. The means and standard deviations from three (panels A and B) and six (panel D) independent replicates are shown. Statistical significance calculated using Welch’s t test is indicated above the graphs.

