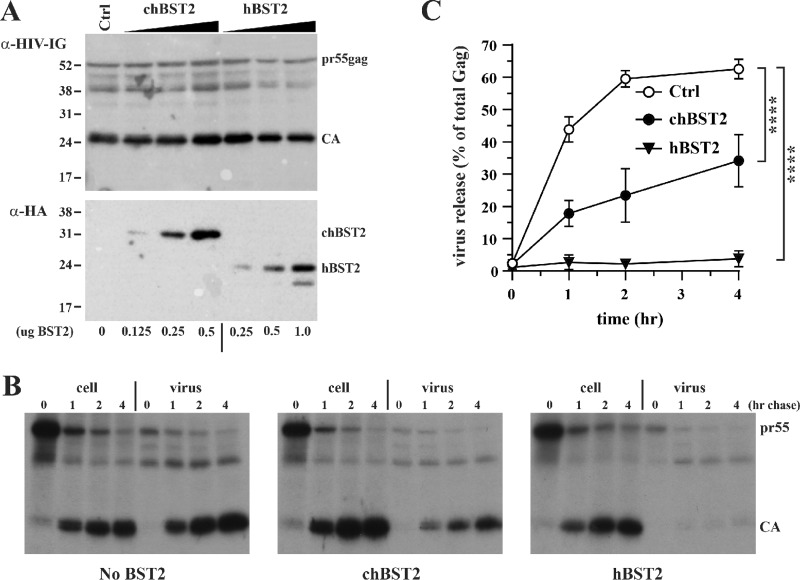
FIG 5.
Characterization of the chBST-2-induced block by pulse-chase labeling of viral proteins. (A) To assess the relative expression of human and chicken BST-2 in the presence of Vpu-defective HIV-1, HEK293T cells were transfected with 4 μg of pNL43Udel in the presence of 1 μg empty vector DNA (Ctrl) or increasing amounts of chBST-2 (0.125, 0.25, or 0.5 μg plasmid DNA) or hBST-2 (0.25, 0.5, or 1 μg plasmid DNA). Total amounts of transfected DNA were adjusted to 5 μg DNA. Cells were harvested 24 h after transfection and processed for immunoblotting against HIV-1-Ig (top) or HA tag-specific antibodies (bottom). Based on these results, we decided to use 0.3 μg of chicken BST-2 vector and 0.75 μg of human BST-2 vector for the subsequent pulse-chase studies. (B) HEK293T cells were transfected with 4.5 μg of pNL43Udel together with 0.75 μg empty vector (No BST-2), 0.3 μg of chicken tetherin vector (chBST2), or 0.75 μg human tetherin vector (hBST2). Total amounts of transfected DNA were adjusted to 5.25 μg using empty vector DNA. After 24 h, cells were metabolically labeled for 25 min with [35S]-Expre35S35S-label and, after removing unincorporated isotope, were chased for up to 4 h in complete DMEM. Cell extracts and virus-containing supernatants were immunoprecipitated with an HIV-positive patient serum and separated by SDS-PAGE. Gels were dried, and labeled proteins were visualized by fluorography. Representative fluorographs from one of three independent experiments are shown. (C) Gag proteins (Pr55 and p24 CA) were quantified by phosphorimage analysis. The proportion of total Gag protein released from the cells was calculated for each time point, and results were blotted as a function of time. Error bars represent standard deviations from three independent experiments. Statistical significance was determined by two-way analysis of variance (ANOVA). ****, P < 0.0001.

